Statistical Question... Yes or No
Measures of Central Tendency
Histograms and Line Plots
Box Plots
Misc.
100
What was the high temperature on Thursday of this week?
No, only one answer
100
Find the median
11, 12, 13, 11, 12, 15, 18, 16, 19, 21, 22
Median- 13
100
The line plot shows the number of hours each band member spent practicing last month.

How many people practiced at least 5 hours?
9
100
What is the IQR for the boys?
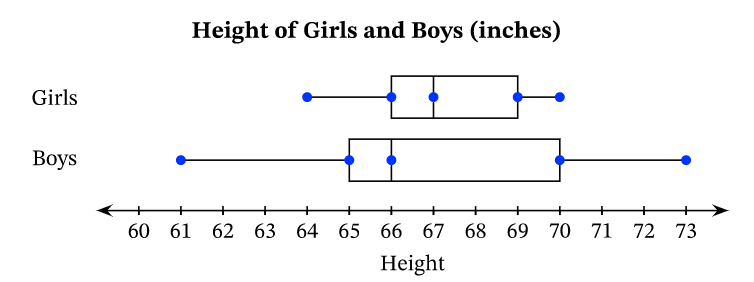
5
100
If McKenna averaged 8 points per game this basketball season. She played in 6 games and scored in each of the 6 games. Her point totals for the games were as follows: 5, 12, 9, 4, 12 and ____. She forgot to write down her last game. How many points did she score in the last game if she averaged 8 points per game?
6
200
What is the best college basketball team in North Carolina?
Yes, would yield various answers
200
Sarah's math test scores: 96, 80, 88, 96, 92, and 100
What is the mean?
92
200
The data shows the distance, in kilometers, 15 people ran. Which line plot shows the data?
8,5,3,6,9,0,6,4,8,3,5,0,9,6,2
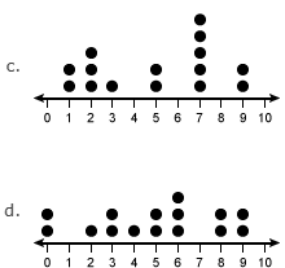
D
200
Find the 5 number summary to complete a box plot for the following data:
11, 12, 13, 11, 12, 15, 18, 16, 19, 21, 22
Lower Extreme: 11
Q1: 12
Q2: 15
Q3: 19
Upper Extreme: 22
200
What are the three ways to describe the shapes of dot plot, referring to the variability of the data?
symmetric, skewed right, skewed left
300
What do 6th grade students prefer to eat for breakfast?
Yes, various answers expected
300
Find the Mode of the following set of data
11, 12, 13, 11, 12, 15, 18, 16, 19, 21, 22, 12
12
300

B. They have the same range
300
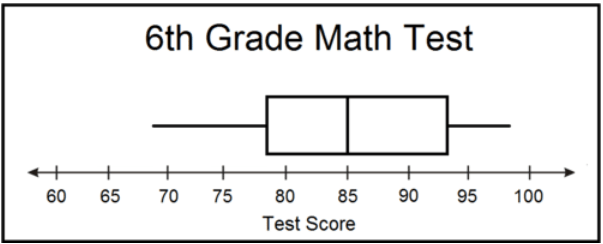
What is the median test score?
85
300
Which describes the shape of the histogram?

Skewed right, Skewed left, Symmetrical
Skewed left (remember the tail of the dinosaur)
400
What color is Brian's hat?
No...only one answer
400
This season, James scored in each game. His points scored in each game were as listed:
4, 8, 2,5, 7, 25, 10, and 3
Which score, if any, could be considered an outlier in the data?
25
400
Based on the histogram, how many students received a score of 91 or higher?

13
400
According to the box plot of the boys, which quartile has the least variability in data?
second quartile
400
Which data most likely have variability for one school during a single school year?
A. The number of students absent each day
B. The amount of time for lunch period each day
C. The cost of slice of cheese pizza each day
the number of students absent each day
500
How much do the animals at the zoo weigh?
Yes...various answers
500
If an outlier is present in a data set, which measure of central tendancy would most appropriately represent the data: the mean or the median?
median
500
What percent of the students in the histogram scored 85 or less on the quiz?

approximately 21%
500
The owner of a super market recorded the number of customers who visited his store each hour on a particular day. The results were 15, 10, 12, 9, 18, 5, 8, 9, 15, 10, and 11. Which boxand-whisker plot matches the data?
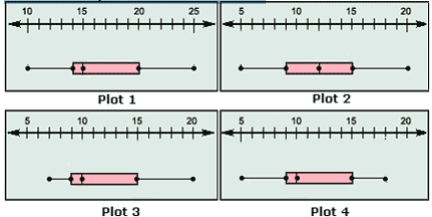
Plot 4
500
What are the differences between a histogram and a bar graph?
numerical data, bars touch, intervals of data