Rational Number Operations
Mean, Median, Mode
Range and IQR
Statistical Graphs
Box and Whisker plots
100
-5 - 10
-15
100
What is the mode?
1.06,9.3,59.59,6.01,25.17,1.06,6,1.06,0.7
1.06
100
what is the range:
5, 10, 19, 17, 35.3, 3, 4, 5, 6, 7, 1.7
33.6
100
What fraction or percentage of data is in each of the 4 sections of a box and whisker plot.
25%
100
Find the lower extreme
5 10 15 20 25
5
200
-1.8 + 1/2
-1.3
200
What is the median?
93, 47, 37, 49, 25, 12, 13, 57
(37 + 47)/2 = 42
200
what is the median
33 4 5 6 10 15 17 18 19 21 29
4 5 6 10 15 17 18 19 21 29 33
17 = med
200
Can you find the mean using a Histogram?
no
200
What is the upper extreme
5 10 15 20 25
25
300
-9.2 x -.15
1.38
300
What is the median?
103, 2, 23, 156.5, 105.5, 145
104.25
300
What is the third quartile?
99, 34, 23, 43, 103, 91, 198
103
300
Identify the peak, gap, outlier, and cluster of the following dot plot:
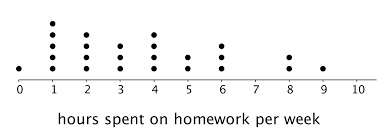
Peak = 1
Gap = at 7
Cluster = 0-6
No outlier
300
What is the first quartile?
1 2 3 4 4 5 6
2
400
-1 1/8 / 2/3
-1 11/16
400
Whats the mean?
1, 1, 2, 3, 4, 4, 5, 6, 7, 8
41/10 = 4.1
400
What is the first quartile?
35, 49, 53, 68, 69, 77, 84
49
400
What is the first step you need to do to make a
box plot?
order the data
400
What is Quartile 2?
1 2 3 4 5 6
5
500
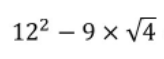
126
500
What is the average grade for a student who's grades are:
13, 27.3, 69, 69, 23, 97.
49.7
500
Find the IQR of the data set.
30, 45, 46, 72, 78, 89, 99, 100, 100
Median = 78
q1 = 45.5
q2 = 99.5
iqr = 99.5-45.5 = 54
500
What are the measures of center that you can find or calculate by looking at a dot-plot?
Mean, Median, Mode, MAD
500
What is the IQR of the data-set
4, 5, 6, 7, 8, 9, 10
4