Dot Plots
Range and IQR
Histograms
Box and Whisker plots
100
How many students took 2 minutes to eat breakfast? 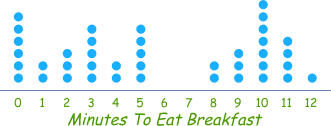
3
100
what is the range
5 10 17 19 35.3 3 4 56 7 1.7
35.3 - 1.7 = 33.6
100
 What is the frequency of cars got 5-10 miles per gallon?
15
100
What's the minimum for class B?
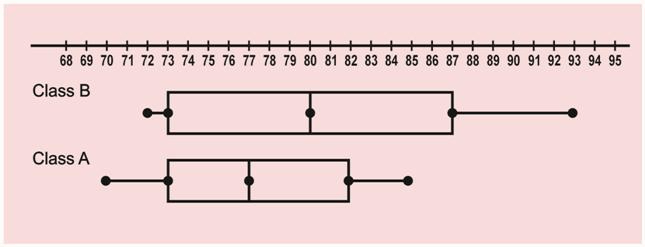
72%
200
How many student's take 10 minutes or more to eat breakfast? 
12
200
what is the median
33 4 5 6 10 15 17 18 19 21 29
4 5 6 10 15 17 18 19 21 29 33
17 = med
200
How many cars were used in the survey?

110
200
What is the maximum for class A?

85%
300
How many students were surveyed?

40 students
300
what is the second quartile?
29 34 39 43 73 91 198
91
300
How many cars got over 20 miles to the gallon?

40
300
 What score is the Q1 for Class b?
73%
400
What is the median number of minutes people take to eat breakfast?

5 minutes
400
Whats quartile 2?
35, 49, 53, 69, 69, 77, 84
77
400
What miles per gallon range is the most common among cars? 
15-20 mpg
400
Who had a higher median? What was the median?

Class B, 80%
500
 What is the mean number of minutes it takes for a student to eat breakfast?
5.625 minutes
500
Find the IQR of the data set.
30, 45, 46, 72, 78, 89, 99, 100, 100
Median = 78
q1 = 45.5
q2 = 99.5
iqr = 99.5-45.5 = 54
500
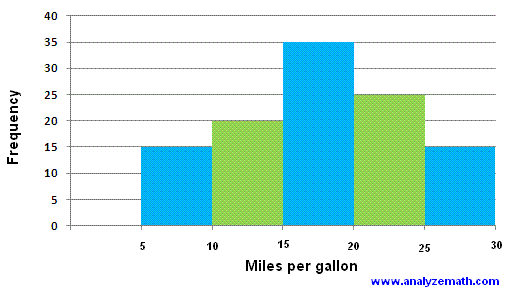
Which 2 groups of miles per gallon is equivalent to half of the data?
10-15 and 15-20
500
Who had the bigger IQR and what was it?

Class B, 14