Statistical or Non-Statistical
Mean, Median, Mode
Dot Plots
Miscellaneous
100
Is this a statistical question:
How many students are wearing Nike tennis shoes in this class?
No.
100
What is the mode?
1.06, 9.3, 59.59, 6.01, 25.17, 1.06, 6, 1.06, 0.7, 9.3
1.06
100
What is the peak of the following dot plot?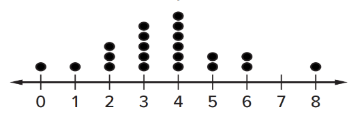
4
100
When thinking about calculating a mean, median and mode...which of those requires you to put the data in order?
Median and mode
200
Should a statistical question have a single answer? Explain your reasoning.
No, it should have multiple answers and a variation in the answers.
200
What is the mode?
34, 29, 38, 34, 31, 29, 38, 36, 36, 29, 34, 31, 38, 36
There is no mode.
200
Are there any outliers in the following dot plot? If so, where? 
Yes, at 10.
200
Mean, median and mode are a measure of _______.
Center
300
Is this a statistical question:
Question to all middle school student, "What is your Iowa standardized test score for last year?"
Explain your reasoning.
Yes. You will get many responses from all the stduents in middle school.
300
What is the median?
103, 29, 23, 156.5, 105, 145, 32, 112
104
300
How many data sets are there in the following dot plot?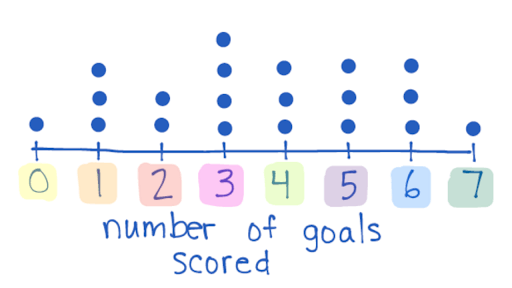
20
300
How do you find the median of a data set that has an even amount of numbers in the data?
Add the middle two amounts and divide it by 2.
400
Is this a statistical questions? Explain.
What is your favorite basketball team?
Yes. You will get many responses from the students in the class.
400
Whats the mean?
1, 1, 2, 3, 4, 4, 5, 6, 7, 8
41/10 = 4.1
400
Are there any clusters present in the following dot plot? If so, where?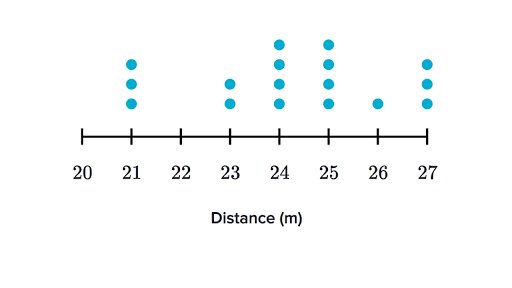
Yes, from 23 to 27
400
Is it possible to not have a mean, median, or mode?
It is possible to not have a mode, but a data set will always have a mean and median.
500
Is this a statistical question:
What is the average weight of 11th grade students in America? Explain.
Yes. You will get many different answers from all the the students surveyed.
500
What is the average:
3, 7, 1, 9, 9, 6, 7, 7, 4, 3, 2, 8
5.5
500
Create a dot plot with the following qualifications:
Peak at 15
A spread from 10 to 30
A gap from 26 to 29
An outlier at 30
Two clusters
A title that makes sense for your data :)
Miss Kimmerling will check the dot plot.
500
Create a dot plot with the following data set:
49, 41, 43, 43, 43, 50, 42, 41, 41, 47, 41, 50, 51, 47, 48, 49, 48, 48, 41
Miss Kimmerling will check the dot plot.