Statistical Questions
Mean, Median, Mode
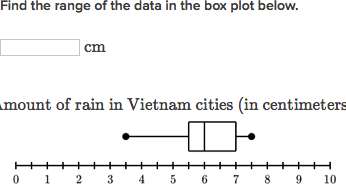
Range
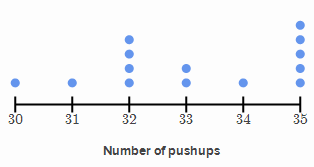
Dot Plots and Histograms
Box and Whisker plots
100
What are the people in Springfield's favorite sports?
What is yes?
100
What is the mode?
1.06,9.3,59.59,6.01,25.17,1.06,6,1.06,0.7
1.06
100
What is the range?
12, 12, 14, 15, 12, 16, 12, 18
What is 6?
100
What is the mode?
What is 35?
100
What is 4?
200
Name at least 2 important things for a question to be statistical.
What is info, population, and multiple answers?
200
What is the median?
7, 8, 16, 11, 9, 13
What is 10?
200
what is the range
33, 4, 5, 6, 10, 15, 17, 18, 19, 21, 29
What is 29?
200
What is the median?
What is 5?
200

What is the median of the data?
What is about 62-64?
300
What is your favorite sport?
What is no?
300
What is the median?
7, 12, 10, 12, 16, 10, 14, 1
What is 11?
300
what is the range
29, 34, 39, 43, 73, 91 198
What is 169?
300

What interval is the mode?
What is 16-20?
300
Draw a box plot for the data.
150, 134, 136, 120, 145, 170, 125, 130, 145, 190, 140
Lowest- 120
Q1- 130
Q2- 140
Q3- 150
Highest- 190
400
Does the Watson Family watch TV?
What is no?
400
What is the mean?
13, 9, 4, 19, 7, 8, 17
What is 11?
400
What is the range?
35,49,53,69,69,77,84
What is 49?
400

Which interval has 300 employees?
What is 11-21?
400
What can be said about the ages of the presidents at their inauguration?
What is they are all roughly 51-58?
500
A survey went around Mr. Patrick's class asking how much you play outside a day?
What is yes?
500
What is the mean?
16, 18, 12, 9, 7, 1, 16, 16
ROUND TO THE TENTHS PLACE
What is 11.9?
500
What is the range?
30.3 ,45,65,72,78,89,97,100.1,100
What is 69.8?
500
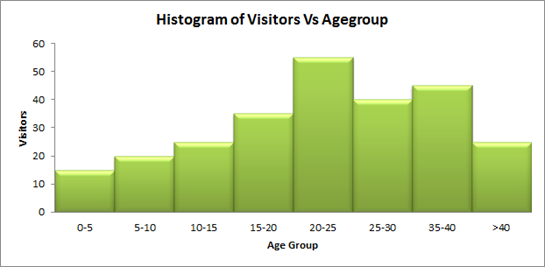
What can you conclude about the data from the histogram?
Answers will vary it is up to Mrs. Weaver's discretion!!
500
Draw a box plot for the following data.
10, 8, 9, 7, 10, 12, 14, 14, 16, 10
Lowest- 7
Q1- 9
Q2- 10
Q3- 14
Highest- 16