Measures of Center
Measures of Variation
Data Displays
Step by Step
Random
100
Find the Mode of the following set of data:
11, 12, 13, 11, 12, 15, 18, 16, 19, 21, 22, 12
12
100
What is the range?

4
100
What are the 3 types of graphs that we have learned?
Dot Plot
Histograms
Box Plot
100
How do you find the mode?
Find the number that occurs most often in a set of data
100
Which is a statistical question?
A. The number of students absent yesterday
B. Students' favorite pizza
C. The number of days in April
B
200
Find the Mean of the set:
2, 5, 5, 6, 7, 2, 4, 8, 1
5
200
What is the range of the data set?
105, 98, 81, 120, 110, 85, 84, 120
39
200
What are some characteristics of a histogram?
1. The bars are connected
2. Each bar shows a range of numbers
200
Explain how do you find the range of the given set of data
Range is the difference between the greatest and the least data.
200
The average score on the last 6th grade math test.
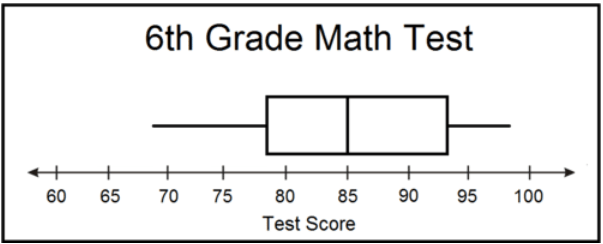
What is the five number summary?
min = 68
max = 98
Q1 = 78
Q2 = 85
Q3 = 93
300
Find the mode of the data set:
2, 2, 5, 4, 6, 3, 2, 7, 4 , 5, 4
2 AND 4
300
Find the IQR of Class 1.
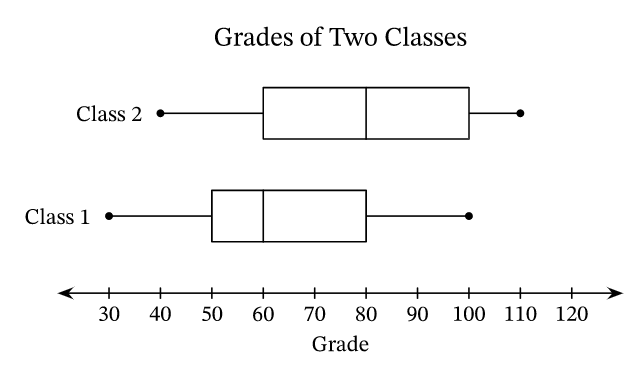
30
300
The distribution with the largest percentage of students 66 inches or shorter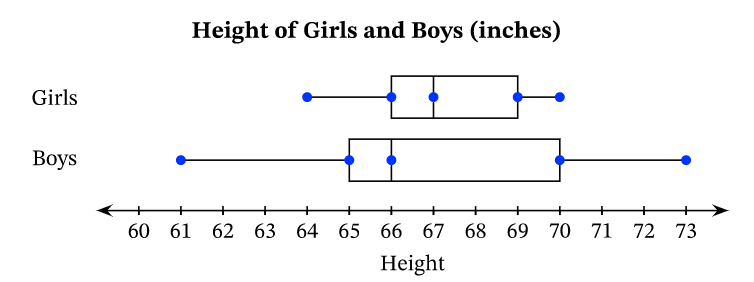
What is the IQR for Boys?
5
300
Explain how to find the mean of a set of data.
All up all the numbers and divide by the amount of numbers given.
300
True or false:
The a mean, mode, and median are included in a five number summary
False, its just the Median.
400
Find the median of the data set:
11, 15, 16, 18, 20, 21, 22, 27
19
400
On average, students in this class had a similar performance in the class.
 What is the range for class 1 and class 2?
class 1 = 70
class 2 = 70
400
What is the median of the data?

2
400
Explain how to find the median of the set of data
1. order from L -> G
2. Find the middle number
400
DRAW a skewed left, a skewed right, and a symmetrical distribution.
Skewed left - tail on the left
Skewed right - tail on the right
Symmetrical - same shape on both sides of center
500
Find the mean of the data set:
14.5, 12.5, 9.5, 8, 10, 11.5
11
500
Find Q1, Q3, Median, Minimum, and Maximum
10, 12, 13, 11, 12, 15, 18, 16, 19, 21, 22
Minimum- 10
Q1- 11
Median- 13
Q3- 19
Maximum- 22
500
List the five numeric values that you need to do a BOX plot
1. Min
2. Max
3. Q1
4. Q2
5. Q3
500
Explains the steps to find AND calculate the interquartile range for the given numeric data
1. Order L -> G
2. Find Q2 (Median)
3. Find the median for first and third quartile
4. IQR = Q3 - Q1
500
How do you find the Mean Absolute Deviation (MAD)?
Find the mean (average) of the data.
Find the distance of each data point from the mean.
Find the mean (average) of the distances.