Statistics
Graphs
2D Geometry
3D Geometry
Mixed Bag
100
To find this, you must arrange all of the data in order and identify the middle value.
What is the median?
100
This type of graph is best for showing results in percentage form.
What is a Pie Chart?
100
What is the best name for a 4-sided 2D shape?
Quadrilateral
100
This is what it is called when a 3D shape is "unfolded" and shown as all of its faces laid flat.
What is a net?
100
A dot plot looks like this and is used in this particular way.
A number line with Xs on top to signify how many times each number/data point appeared in the data set.
200
These are the steps for solving for the mean of a data set.
What is add up all of the values in the data and then divide the total by the number of values there were?
200
This type of graph uses symbols or portions of symbols to represent values/quantities.
What is a Pictograph
200
Explain all the other ways a square can be categorized.
Answers will vary.
200
Define surface area and how it is solved.
Surface area is the total area of all the faces of a 3D shape. To solve, find the area of each side and add them all together.
200
Mateo has a gift to wrap that measures 7 inches tall, 4 inches wide, and 5 inches long. What is the least amount of wrapping paper he can use to cover all the sides entirely?
166 in2
300
Identify the Mode of the data set:
3, 7, 20, 3, 4, 15, 2
The mode is 3.
300
This type of graph is best for showing changes over time.
What is a line graph?
300
Name the three categories of triangles based on the lengths of their sides. Define each one.
What are: isosceles, scalene, and equilateral?
I: two sides the same length
S: all three sides different lengths
E: all three sides the same length
300
A shape with two identical bases (top and bottom) connected by rectangles.
What is a prism?
300
Find the volume of a triangular prism with the following dimensions:
Triangle has a base of 5cm and a height of 8cm
The rectangle sides have a height of 9cm.
180 cm3
400
The range of the following data set:
11, 2, 17, 30, 12, 4
What is 28?
400
This type of graph divides the data up into quartiles, and shows each quarter of the data taking up a different section of a number line. It demonstrates the range and median of the data most clearly.
Box & Whisker Plot
400
Provide the formula for Area of a Triangle.
What is (BxH)/2 ?
400
A shape with only one base which has sides the shape of triangles that meet at a point at the top is called this.
What is a pyramid?
400
What are the types of triangles based on angle measures? Define them.
Obtuse, Right, Acute
O: has an angle measuring greater than 90*
R: has a 90* angle
A: all angles are less than 90*
500
Gaby is asking her friends how many times they have been to a live performance in the last year. These are the numbers they reported:
3, 5, 10, 9, 6, 4, 9, 2
What is the median number of shows her friends have attended? What is the mean?
Median: 5.5
Mean: 6
500
How does one divide a set of data into quartiles to build a box and whisker plot?
Find the Median of the data to split it into two halves, then find the median of each half of the data.
500
Solve for the area of the following compound shape:
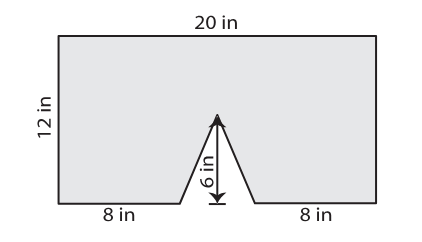
228 in2
500
Define volume and explain how to solve for the volume of a rectangular prism.
Volume is the amount of space inside of a 3D shape. It is solved by multiplying length x width x depth/height.
500
The fillable space in Luisa's fish tank measures 3 feet long, 2 feet tall, and 1.5 feet wide. If it takes five minutes to fill each cubed foot with water, how long will it take to fill up?
What is 45 minutes?