Vocabulary
Relationships with Tables
Relationships with Equations
Relationships with Graphs
Proportional vs Non Proportional
100
These are the variables that represent the left side and right side of the ratio table, respectively.
They also represent coordinates on a plane.
What are
X and Y
100
These are the letters and colors that represent the left and right columns.
What is blue, left, x?
What is red, right, y?
100
The equation p = 0.8 • r represents the amount of money it costs (p) to buy a meter of rope (r).
Mr Lessard bought 100 meters of rope.
This is how much he spent.
What is $80?
100
The vertical axis is represented by this variable, and the horizontal axis is represented by this variable?
What are y (vertical), and x (horizontal)?
100
Is it Proportional or is it Not Proportional?
----------------------------------------------
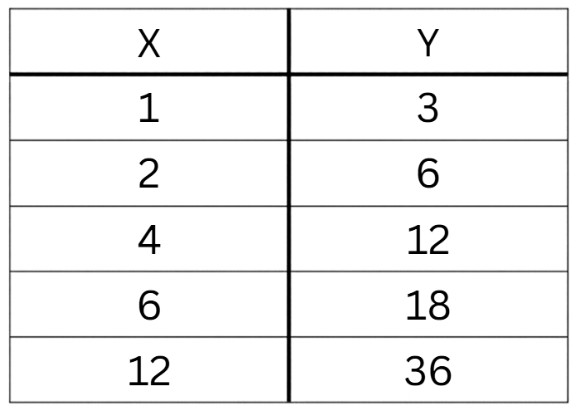
When x increases by 1 y increases by k
What is proportional?
200
A diagram that shows two quantities in a relationship. This is typically depicted as a T-Table.
What is a ratio table?
200
Dividing the y quantity by its related x quantity will result in this.
What is the calculation to find K, the constant of proportionality?
200
"Interpret the K"
Ted Lasso gets wise and starts selling his biscuits. He uses this equation to calculate the total amount of money he makes at his bake sale:
d = 2•b
d represents dollars, and b represents biscuits. What does the 2 mean?
What is $2 for each biscuit?
200
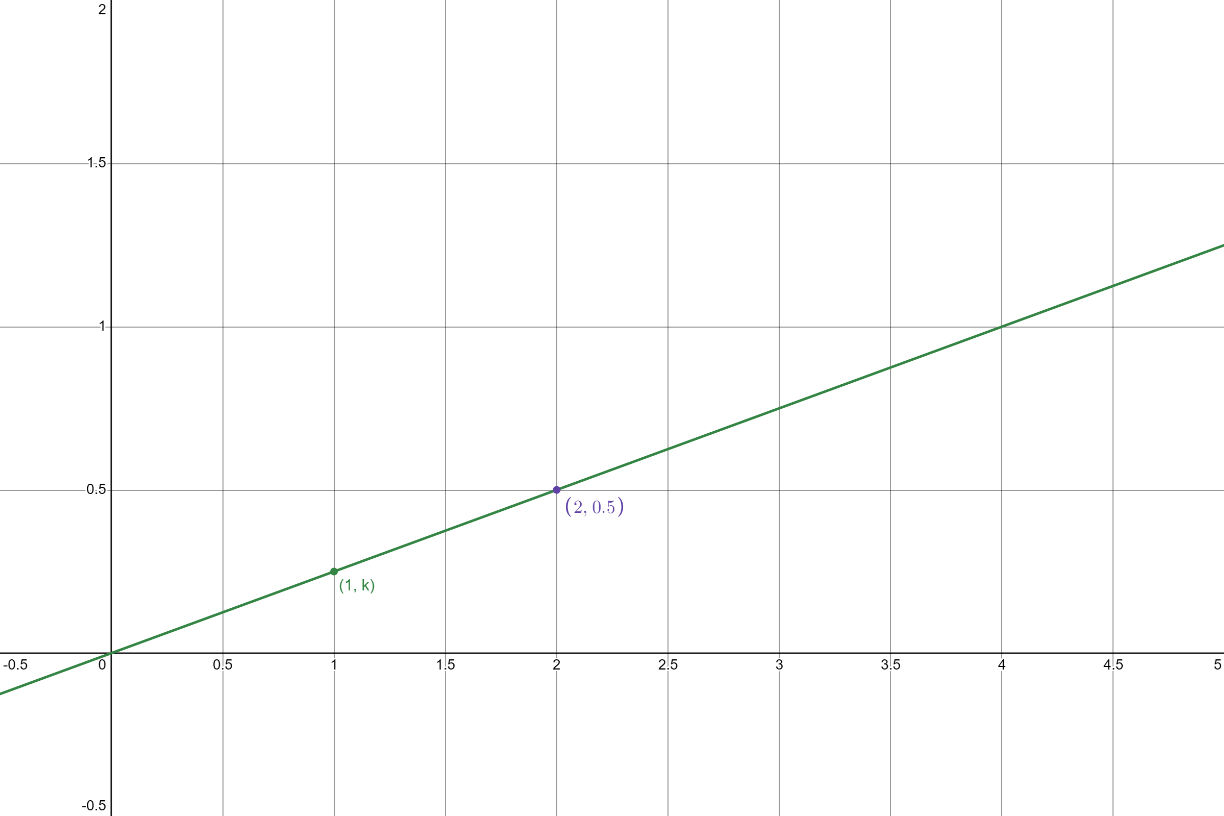
This is the point that represents the unit rate on the graph of a proportional relationship.
What is the point (1, k)?
When the value of x is 1, the value for y represents the unit rate, also known as the constant of proportionality.
200
Is it Proportional or is it Not Proportional?
----------------------------------------------
When x is 0 y is not 0
What is not proportional?
300
Two quantities that are depicted in a table that don't use the same numbers but show the same relationship.
What are equivalent ratios?
300
The calculation to find a missing Y value.
The calculation to find a missing X value.
What is multiplying x by the value, K?
And
What is dividing by y the value, K?
300
It's the equation you can write from this table.
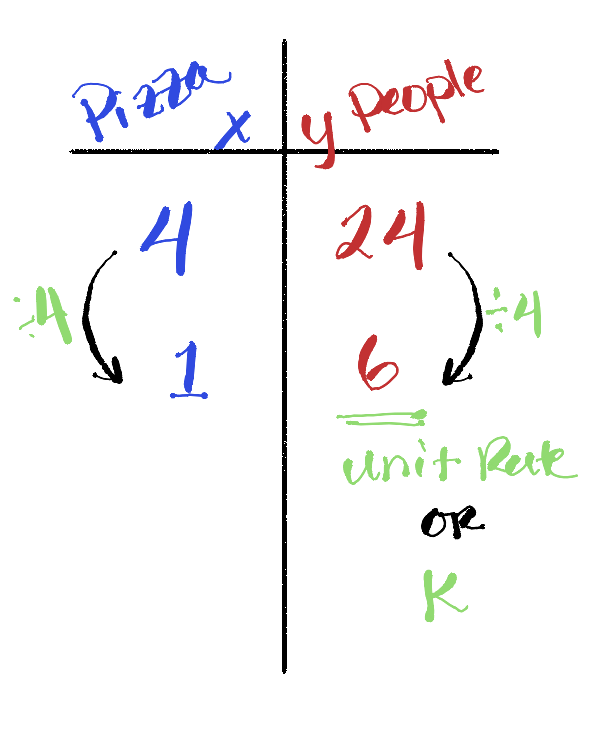
What is
z • 6 = p
300
Which of these colors are graphs of proportional relationships?
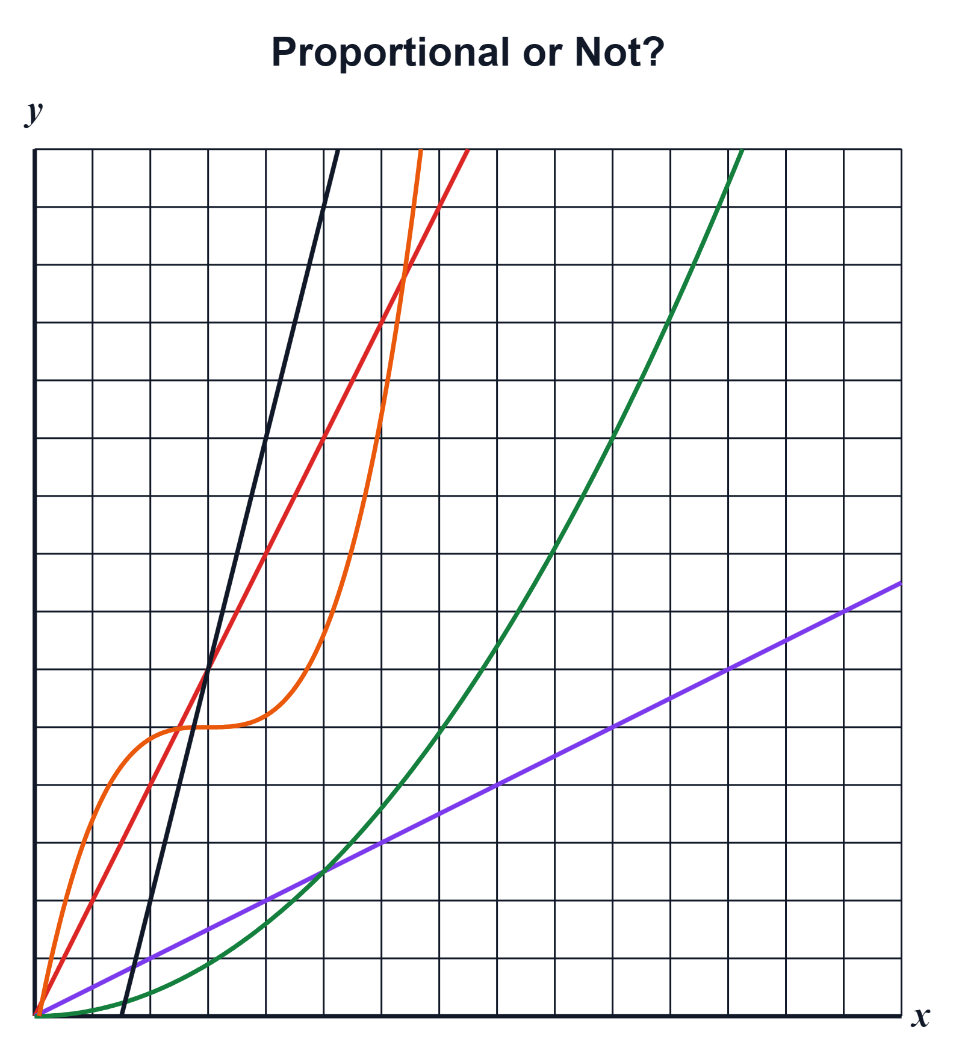
What are Red and Blue
300
True or False
--------------
A not proportional relationship can still have a consistent rate of change between x and y?
What is true?
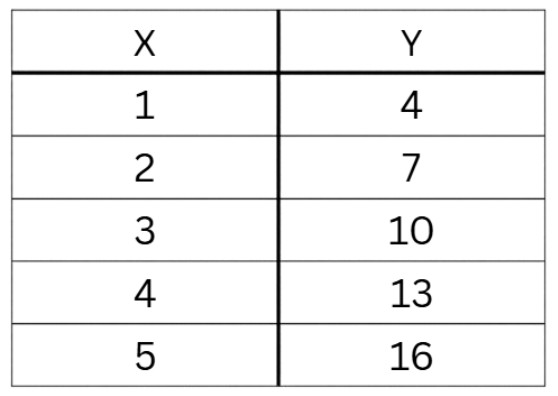
400
A relationship where two quantities change together at the same constant rate.
What is a proportional relationship?
400
This value never changes in a proportional relationship.
What is the CONSTANT of PPROPORTIONALITY.
400
It's the other equation that describes the same relationship
y = k • x
x = 1/k • y
400
The equation for the line represented in this graph:
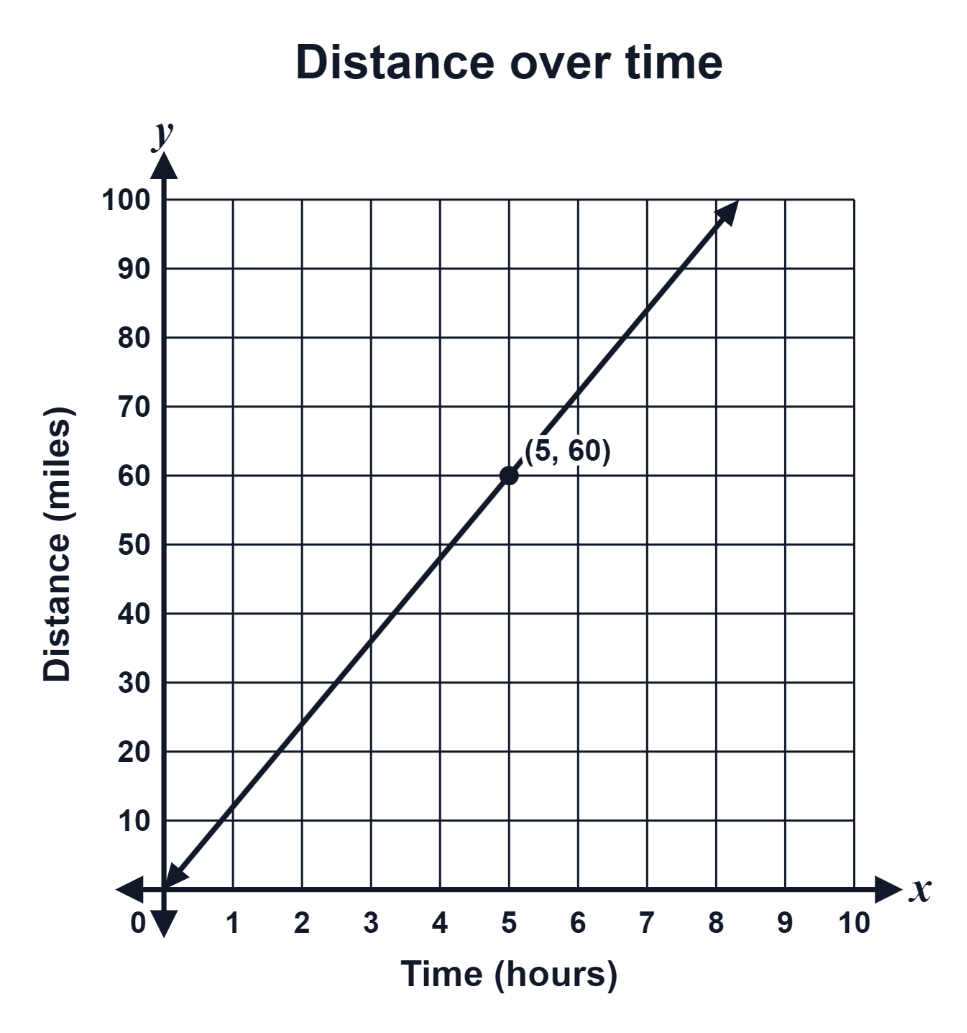
What is:
y=12•x
or
d=12•t
400
True or False
--------------
This is a Proportional Relationship:
y = 0.3•x + 21
What is false?
There is "something extra"
500
The rate at which two quantities are changing together. It's also known as the unit rate.
What is K, the constant of proportionality?
500
Ratio tables work on the outside to keep 2 quantities in equivalence.
Scales work this way to show the relationship between two quantities.
What is between?
What is Left to Right?
What is Right to Left?
500
It's the equation you can write from this story:
Mr Lessard is driving down the highway totally obeying the speed limit. He travels 130 miles in 2 hours.
Use d to represent distance and t to represent time.
d = 65 • t
t = 1/65 • d
500
In the graph of a proportional relationship any set of this will allow you to calculate the constant of proportionality for that relationship.
What are coordinate pairs?
(x, y)
500
What does this "something extra" do to the originally proportional relationship?
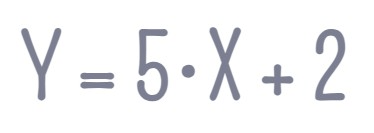
What is it adds 2 to each change in 1 x.
If x = 0 then y ≠ 0