FTC & Perm. vs Comb.
Probability
Conditional Prob. & Binomial Prob.
Measures of Center & Measures of Variation
Misleading stats, Box Plots and Scatter Plots
100
You want to make a sandwich. There are 3 bread choices, 4 cheese choices, 5 meat choices, and 5 sauce choices. How many different sandwiches could you make?
300
100
What is the probability of randomly choosing a day of the week that does not start with the letter T?
5/7
100
A number 1-100 is randomly selected. What is the probability that it is an odd number, given that it is a perfect square?
1/2
100
Find the standard deviation of the data with a calculator.
37, 42, 48, 51, 52, 53, 54, 54, 55
5.83
100
What makes this a misleading graph?
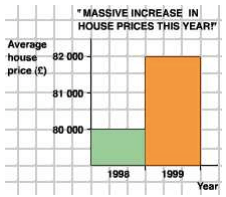
y-axis doesn't start at 0. The difference looks huge! However, it's only a difference of $2000.
200
Combination or Permutation?
You have 7 kittens. How many different ways can you dress them up as Garfield, Hello Kitty, and Tom?
Permutation
200
What is the probability of drawing a red jack out of a standard deck of playing cards.
1/26
200
What is the probability that the person likes basketball, given they are male?
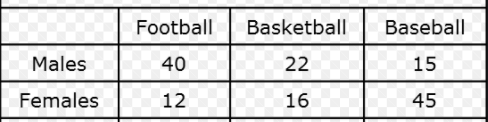
2/7
200
A normal distribution of scores has a standard deviation of 10 and a mean of 40. Find the z-score that corresponds with a score of 60.
2
200
What is the median of the data presented in the box plot?

6
300
In how many different ways can you arrange the letters in the word hippopotamus?
39916800
300
You roll a die and draw a card from a standard deck. What is the probability you roll a prime number and draw a club?
1/8
300
What numbers go in the highlighted boxes?
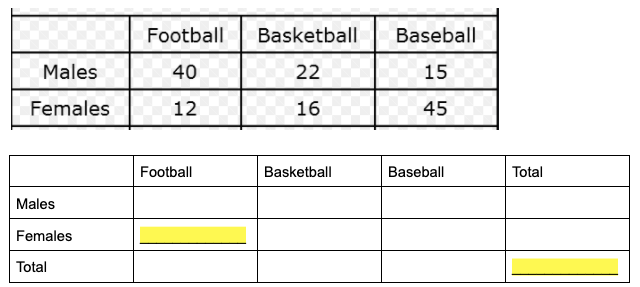
0.08 and 1
300
Find the Mean Absolute Deviation for the data set:
2, 3, 3, 3, 4, 4, 6, 7, 12, 18, 19
4.89
300
What is the IQR of the data presented in the box plot?

8
400
There are 56 students on a team. How many ways can you select 5 of them to ride the van to the game instead of the bus?
3819816
400
Your drawer contains 5 red socks, 4 black socks, and 10 white socks. You pick out a sock, don't like the color, put it back, and then choose another. What is the probability you get a black sock, then a white sock?
40/361
400
You take a multiple choice test and guessed on the last 8 questions. What is the probability that you get exactly 3 correct?
20.76%
400
The price of gas at 75 gas stations is normally distributed with a mean of $2.15 and a standard deviation of $0.05. What percent of gas stations sell gas for at least $2.20?
15.9%
400
Find the correlation coefficient for the two variables.
V1: 4, 7, 19, 13, 19, 20, 25, 37, 48, 50, 51
V2: 10, 12, 14, 5, 18, 29, 40, 50, 55, 61, 58
Is there a strong, weak, or moderate correlation between the 2 variables?
r = 0.9522
Strong correlation
500
There are 15 applicants for the following jobs: Computer Programmer, Software Tester, Manager, and Systems Engineer. In how many different ways can the company hire people for these jobs?
32760
500
Your drawer contains 5 red socks, 4 black socks, and 10 white socks. You pick out a sock and then choose another. What is the probability you get a black sock, then another black sock?
2/57
500
Sarah randomly chooses a day of the week 5 times. What is the probability that she chooses Wednesday at least 4 times?
0.18%
500
The golf scores in a tournament are normally distributed with a mean of 76 and a standard deviation of 2.6. Find the given probability.
P(X > 78)
22.1%
500
The scatterplot and regression line below show the average income, in dollars, in several major American cities plotted against the rent for a 222-bedroom apartment in those cities.
The fitted line has a slope of 0.0310
What is the interpretation of this slope?
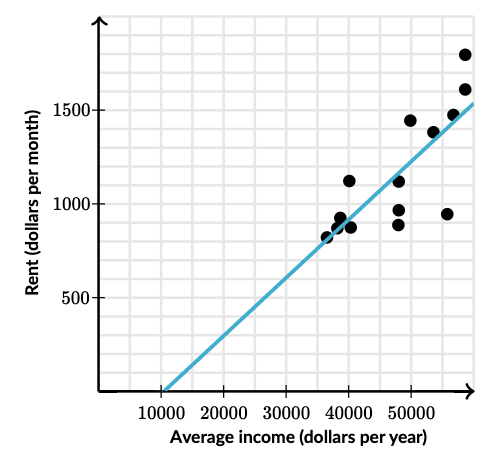
On average, each $1 increase in average income was associated with a $0.031 increase in average rent.