Biased, Bro
So Mid
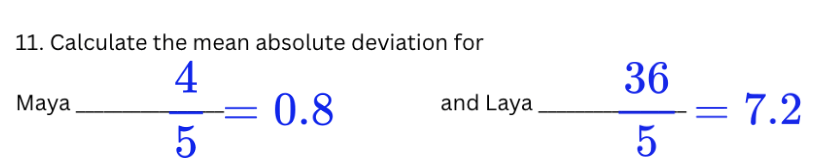
Don't Go MAD
Well That's Graphic
Analyze This
100
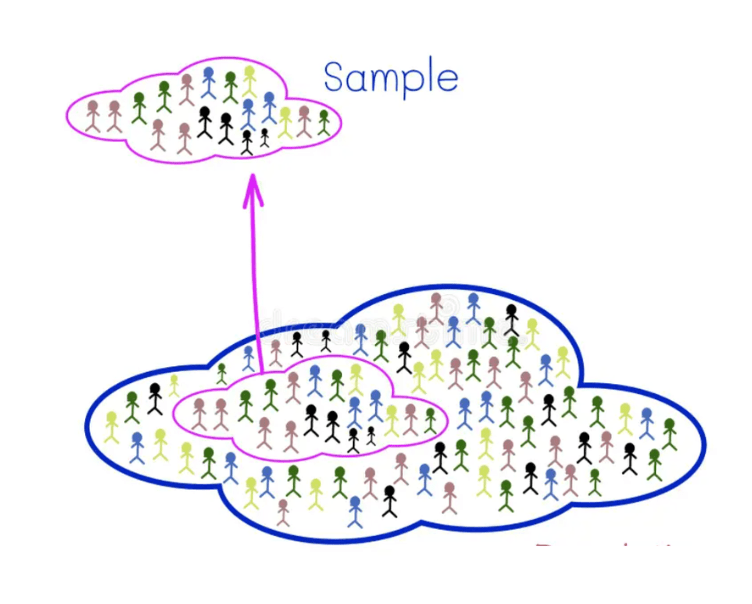
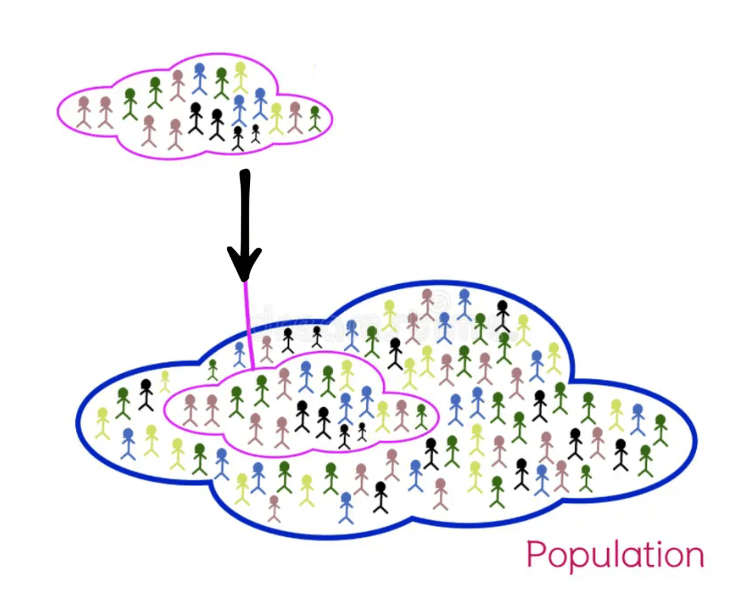
This type of group is a smaller, manageable subset of an entire group used to make inferences about the whole.
What is a sample?
100
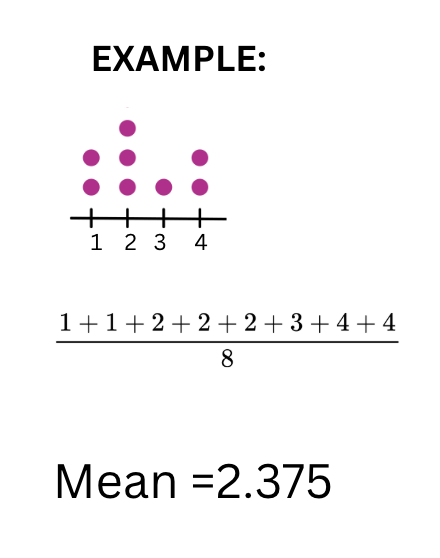
You find this value by adding all the numbers in a data set together and dividing by how many numbers there are.
What is the Mean?
100
This measure describes how spread out the values in a data set are from the mean.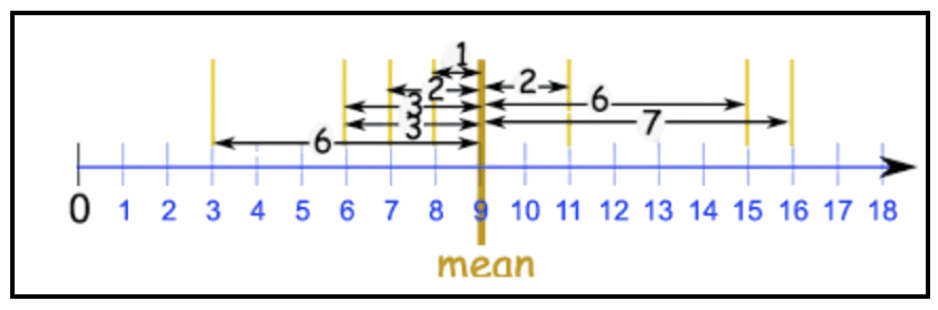
What is the Mean Absolute Deviation?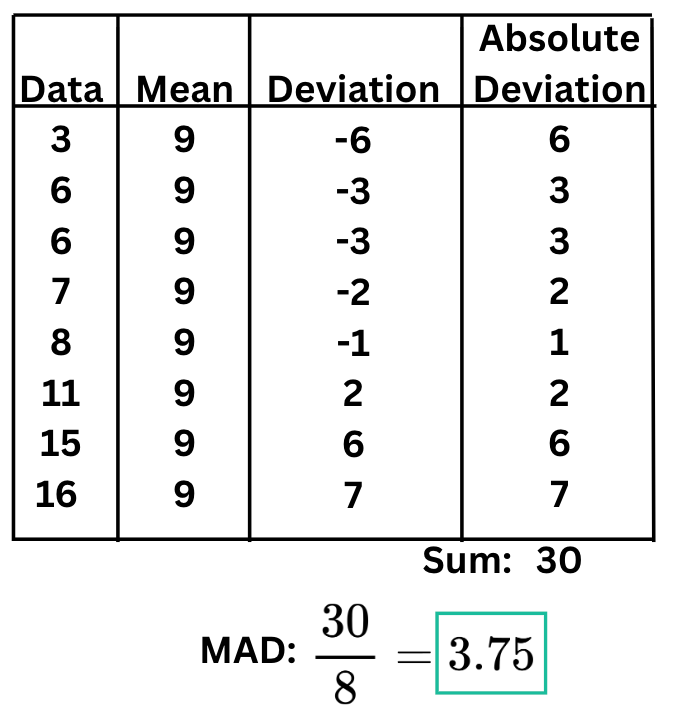
100
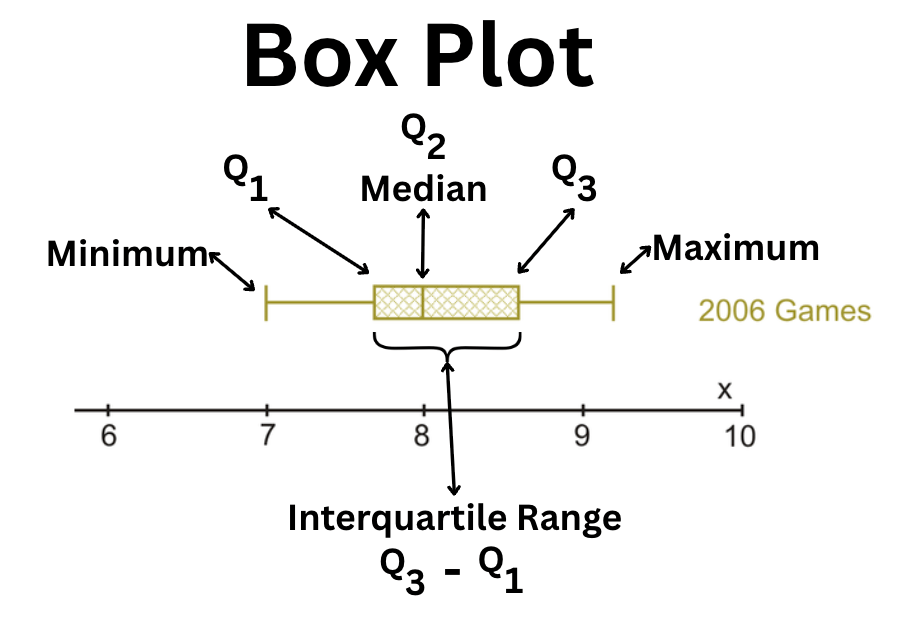
This type of graph includes "whiskers" to show the distribution of data across four quartiles.
What is a Box Plot?
100
This is the process of using an experiment or a model to mimic a real-world situation when the real thing is too difficult to perform.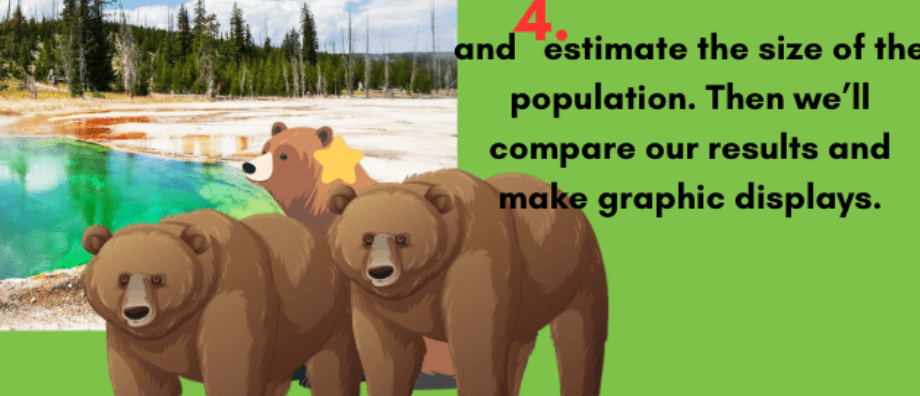
What is a simulation?
200
This is the entire group of people or objects that a researcher wants to gather information about.
What is a population?
200
This is the middle number in a data set when the numbers are listed in order from least to greatest.
What is the Median? 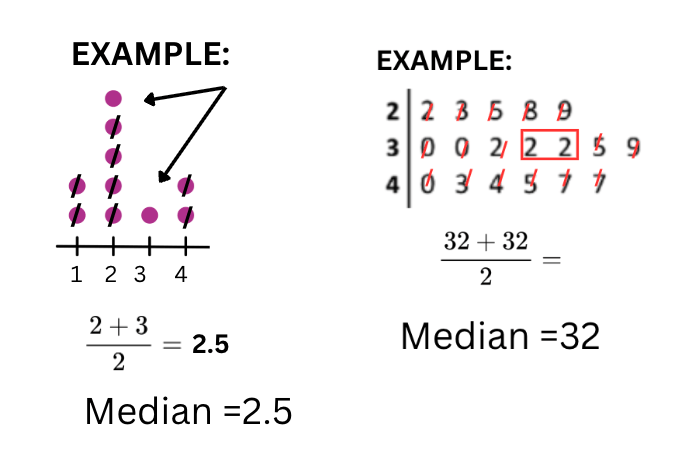
200
This is the first step in calculating the MAD, which involves finding a measure of central tendency.
What is calculating the Mean?
200
This display shares a central "trunk" and allows you to compare two sets of data using their single digits.
What is a Back-To-Back Stem Plot?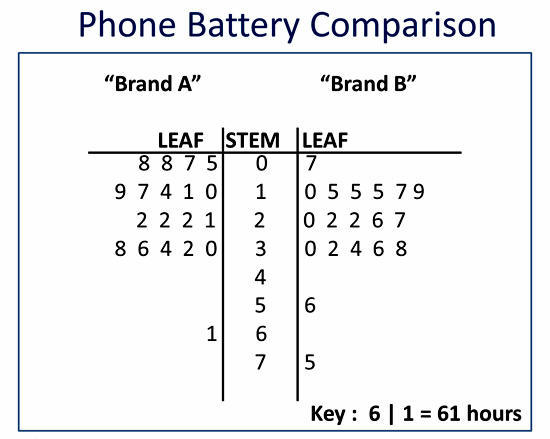
200
This is the specific part of a simulation where you actually record the results of your trials.
What is data collection?
300
This occurs when certain individuals are more likely to be selected for a survey than others, leading to results that don't represent the whole group.
What is under representation bias?
300
This is the most frequently occurring value in a data set.
What is the Mode?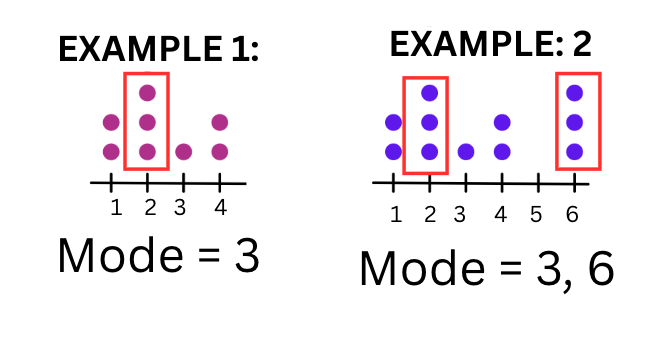
300
If a data set has a very small MAD, it means the distribution or spread of the data is this.
What is close together or clustered?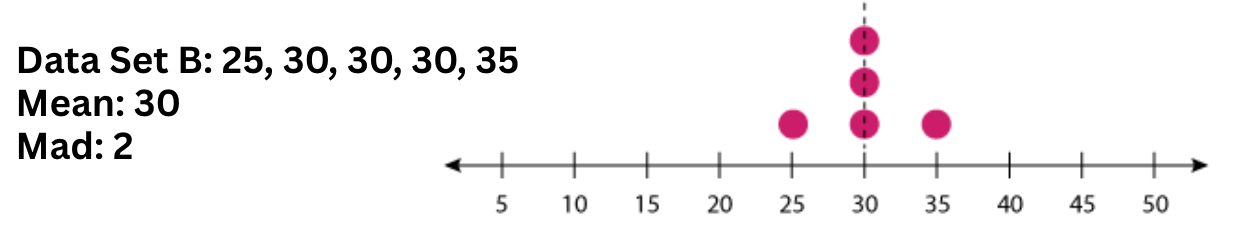
300
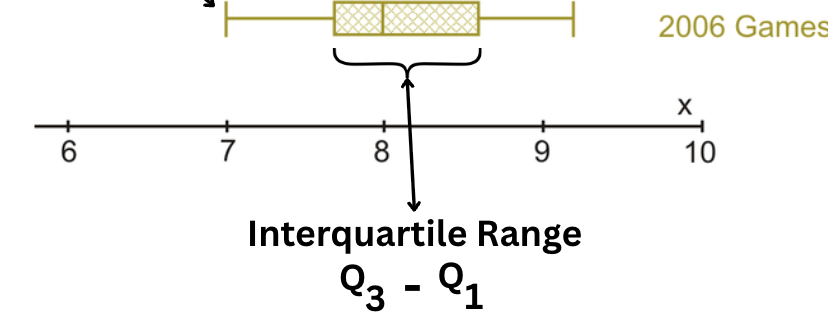
This is the visual representation of the distance between the first quartile (Q1) and the third quartile (Q3) in a box plot.
What is the Interquartile Range?
300
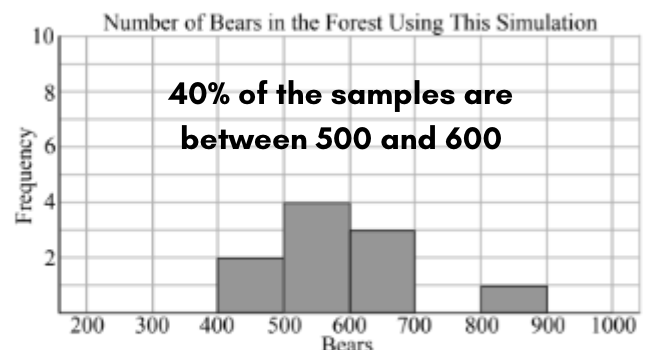
After gathering data from 100 simulation trials, you calculate this to find out how often a specific event occurred out of the total.
What is percent or the frequency?
400
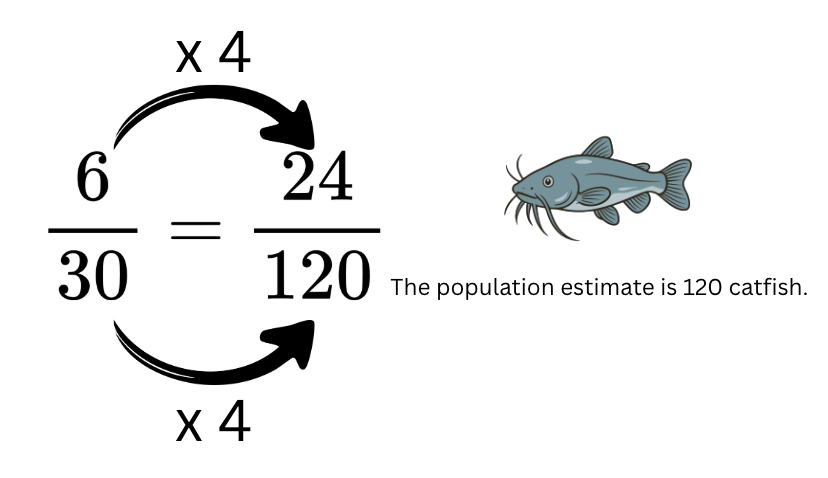
This specific method of data collection involves tagging a small group of animals, letting them go, and then catching a new group later to estimate the total population size.
What is Capture, Mark, Release, Recapture or CMRR?
400
This is one of the three measures of central tendency and is the best one to use if there are outliers in a data set.
What is the Median?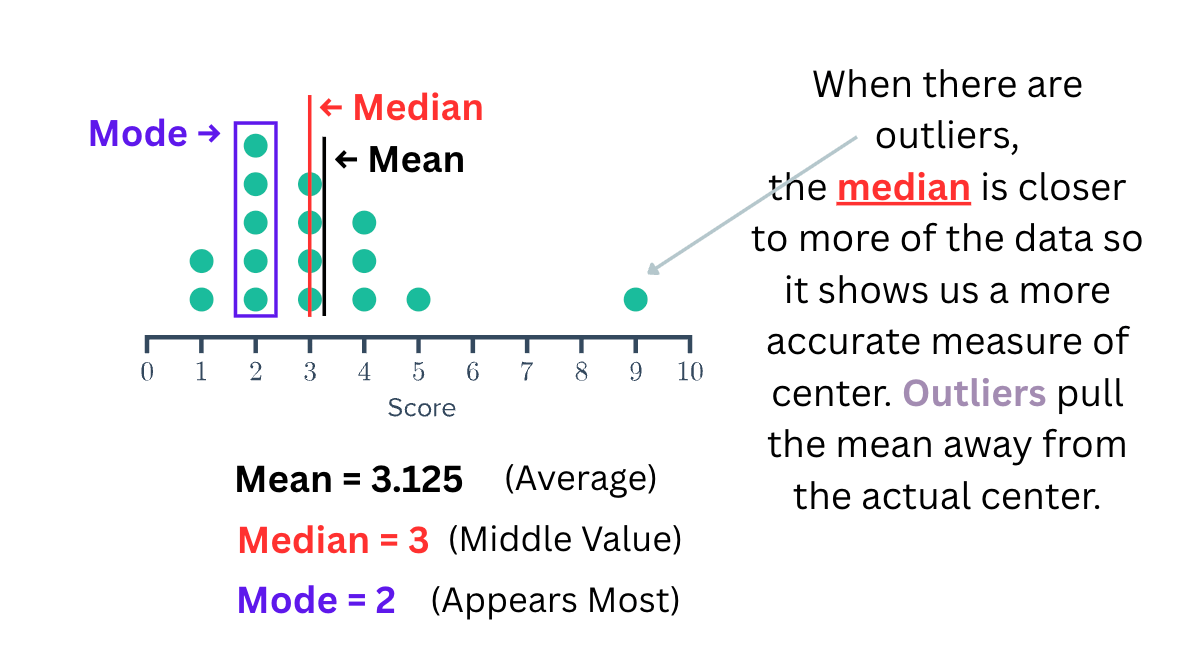
400
This is the mathematical term for the distance a single data point is from the mean (always expressed as a positive number).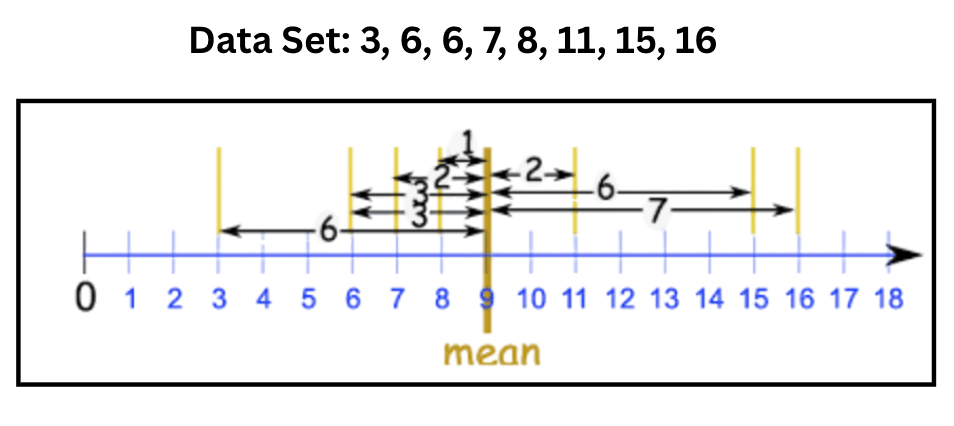
What is the Absolute Deviation?

400
This is the primary advantage of using a "double" version of a graph rather than two separate ones.
What is comparing two data sets?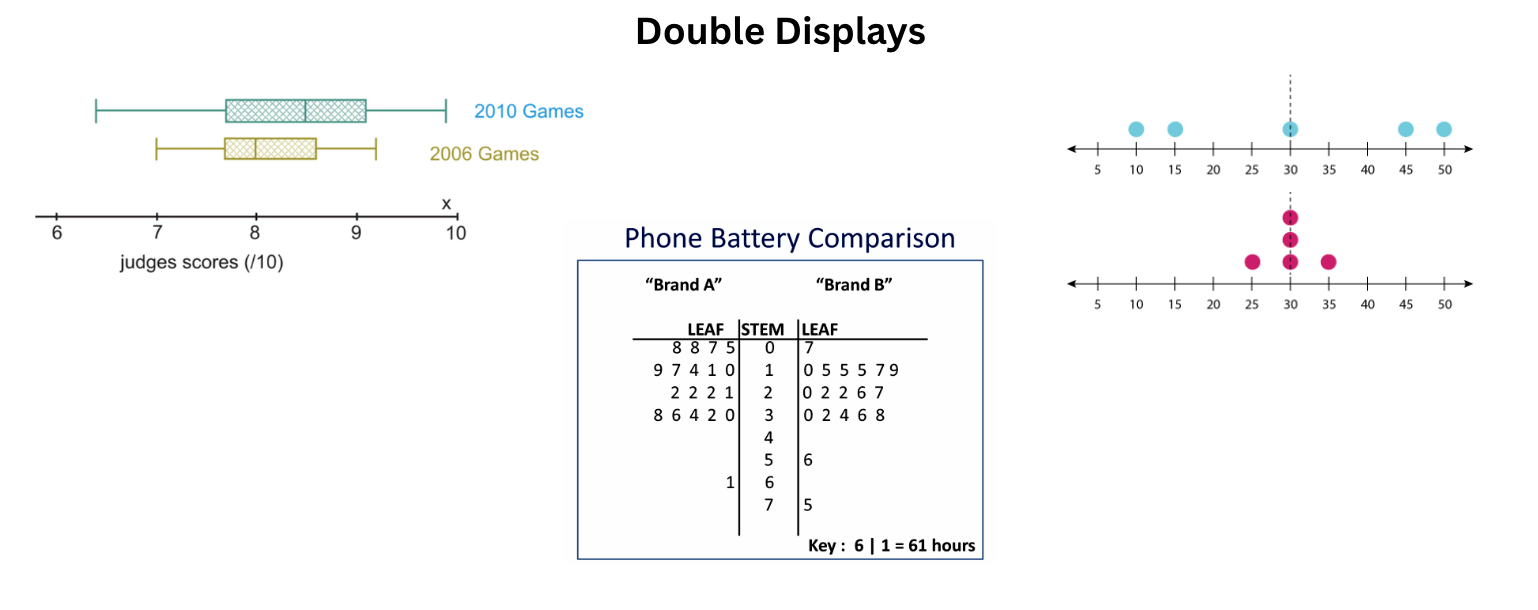
400
These are the two main steps required after collecting data but before you can interpret it.
What is organizing and modeling data?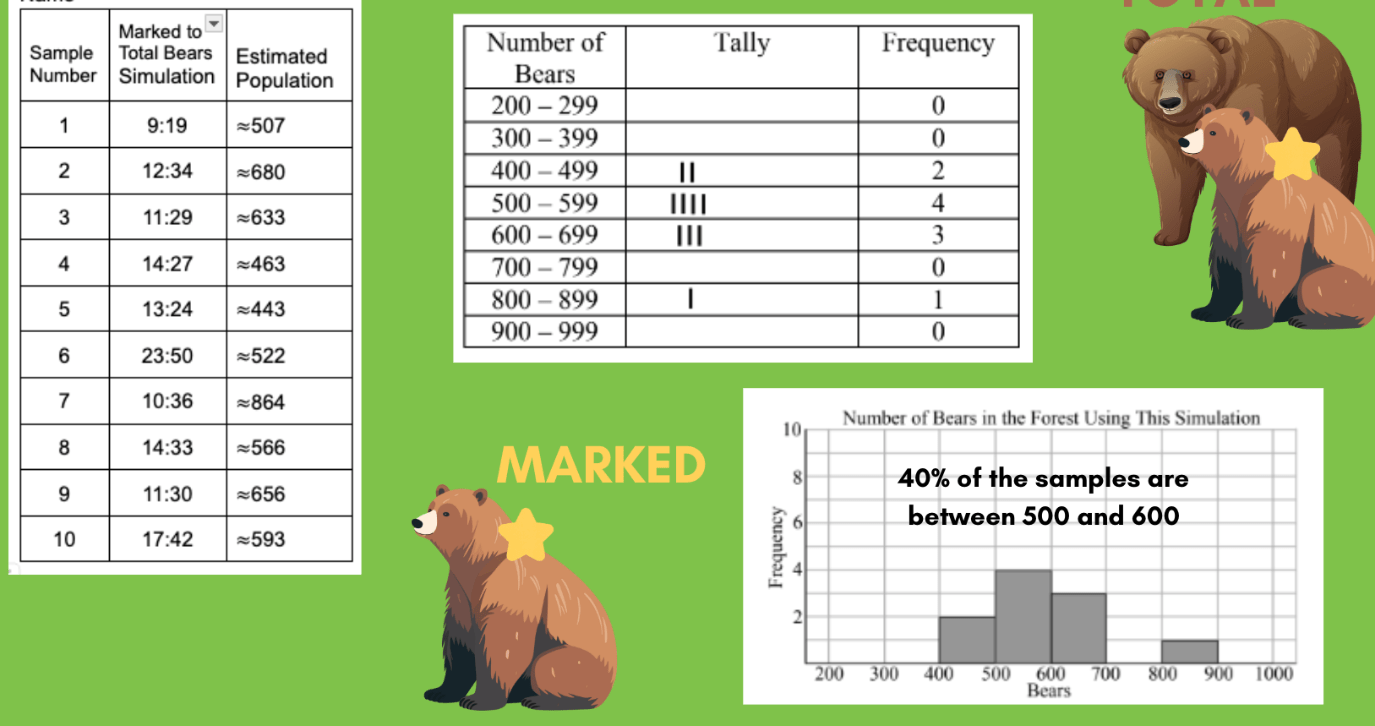
500
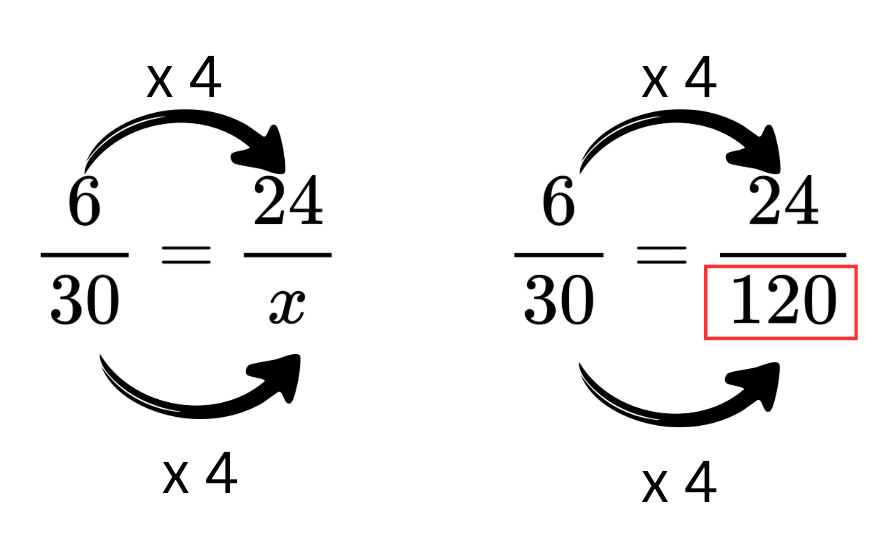
This mathematical statement shows two ratios are equal and is used to estimate a population size based on sample data.
What is a proportion?
500
This tool allows a mathematician to look at the centers of two different data sets at the exact same time to see how they compare.
Example: In which Olympics were athletes scores higher on average?
What is a Double Box Plot?
Example: 2010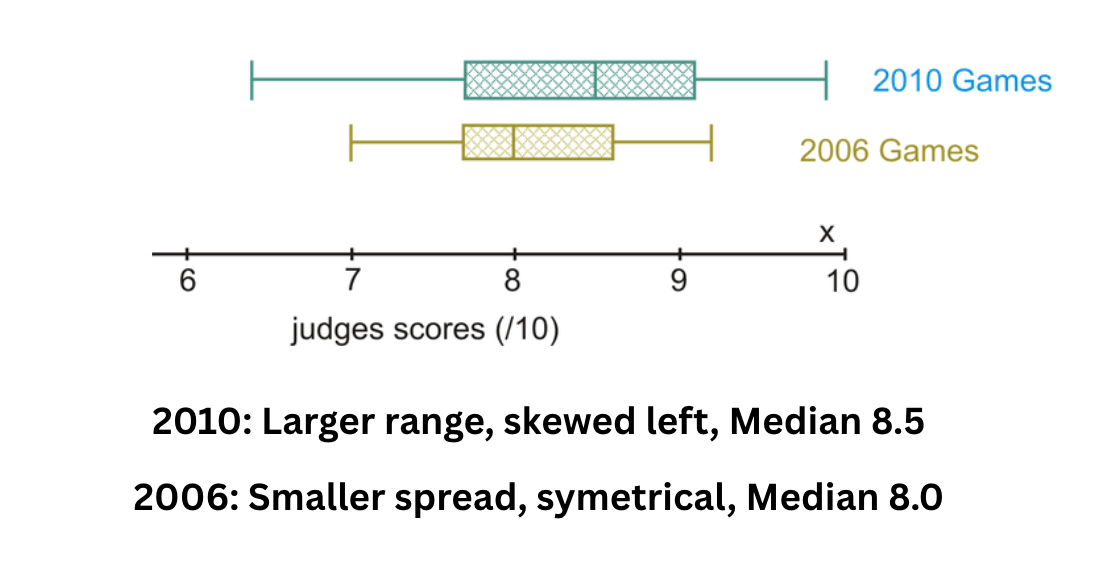
500
In a real-world context, a high MAD in a set of test scores suggests this about the consistency of student performance.
What is inconsistent or highly varied or spread out?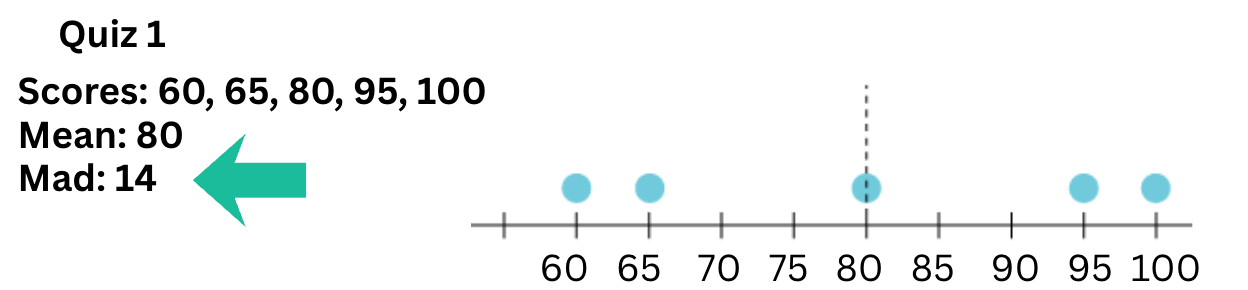
500
These are the three main things you look for when comparing any two graphical displays: Center, Spread, and this (the overall look of the data).
What is Shape?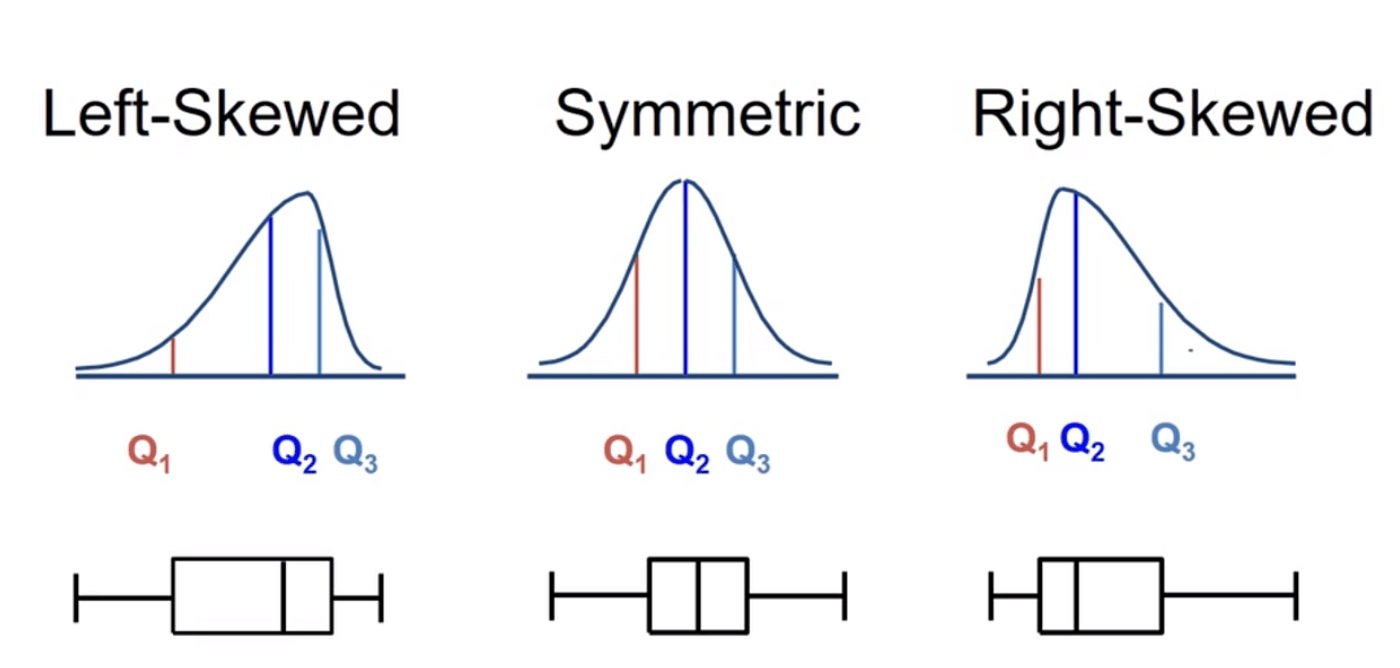
500
This is the ultimate goal of collecting, organizing, and displaying data in a statistics unit.
Example: Who should Coach Borden take to the championship basketball game?
What is making inferences or drawing conclusions?
Example: Coach should take Maya, because she's a more consistent player.