Definitions
Population/Samples
Biased/Unbiased
Biased/Unbiased
Box Plots
Dot Plots
A little probability
100
Define Mean
What is the average of a set of data
100
Identify the population and the sample for the below question. A survey of 1353 American households found that 18% of the households own a computer.
Population: All American Households
Sample: Survey of 1353 of those households
100

The principal determined that the boys had more variability than the girls. Which of the following statements BEST describe the conclusion of the principal?
A. It is true because the median of the girls is greater than the median of the boys.
B. It is not true because the maximum number of the boys is greater than the maximum number of girls.
C. It is not true because the shape of the girls plot is asymmetrical.
D. It is true because the range of the boys is greater than the range of the girls.
What is D?
100

TRUE OR FALSE? The mean of the girls height is greater than the mean of the boys height.
What is false?
100
True or False?
An event with the probability of ⅘ is more likely to happen than an event with the probability of ⅚.
What is false?
200
Define Median and Mode
Median is the middle number of a data set
Mode is the number that occurs the most in a set of data
200
Which scenario represents an unbiased sample?
A. Ten students are randomly selected to participate in a survey about classes they like.
B. Every 50th student that enters the schools is asked their favorite color.
C. A phone-in survey is taken by a DJ of a radio station about how many listeners like the music played on that station.
D. A survey is sent out to 100 parents of each grade level to vote on having a school dance or not.
What is B or D?
200
What conclusion can you draw from the box and whisker plots below?
A. The grades for Mr. Calgary’s class have a smaller range than the range of Mr. Edmonton’s class.
B. The median for Mr. Edmonton’s class is the same as Mr. Calgary’s class but Mr. Calgary’s class has a greater interquartile range.
C. The median is about the same in both classes, and they both have the same range.
D. Mr. Edmonton’ has a larger interquartile range, but the medians are the same

What is B?
200

What is the mean number of house of video game playing?
What is 8.79 hours?
200
Kate flipped a dime 8 times. It landed on head 5 times and tails 3 times. Theoretically, if she flips the coin a 9th time, which of the following statements are TRUE?
A. It is not likely to be tails.
B. It more likely to be tails.
C. It is more likely to be heads.
D. It is equally likely to be heads or tails.
What is D?
300
What is the interquartile range? And what percentage of data is located within the IQR?
What is it is the range between Q1 and Q3? What is 50%?
300
Jaquan wants to find out the most popular football team at a game between Grayson and Brookwood. Which method would give him the most accurate information?
A. Surveying the people in Grayson stands
B. Surveying the people waiting in line for tickets
C. Surveying the cheerleaders from Brookwood
D. Surveying all of the coaches
What is B?
300

Mrs. Nalepa said more donuts were consumed at the County Fair. True or False? How do you know.
False. The median for the county fair is less than the median for the city exhibition.
300
Set A has greater variability that Set B. True of False.
What is false?
300
At last weekend's soccer game, 15 out of the first 25 people who entered were wearing Bay Creek gear. If this sample is representative of the 145 people attending the game, about how many of them will probably be wearing Bay Creek gear?
What is approximately 87 people?
400
What is MAD, what does it tell you about a data set, and how do you calculate it?
What is Mean Absolute Deviation? It is a measure of spread or how far the data is from the mean. You find the mean and subtract each data point from the mean. Take the absolute values of your solutions add them together and divide by the number of data points in the set.
400
Which scenario is a biased sample of finding out the favorite subject of students at Bay Creek Middle School?
A. Randomly selected every 15th student that enters the cafeteria
B. Sending out a survey to all homeroom teachers for their students to fill out asking what their favorite subject is.
C. Asking all the students in PE what their favorite subject is.
D. Randomly selected 50 students to survey from each grade level.
What is C?
400

Mrs. Clark stated that 50% of pine trees are over 9 feet tall, and 75% of oak trees are over 7.5 feet tall? True or False?
What is False?
400
.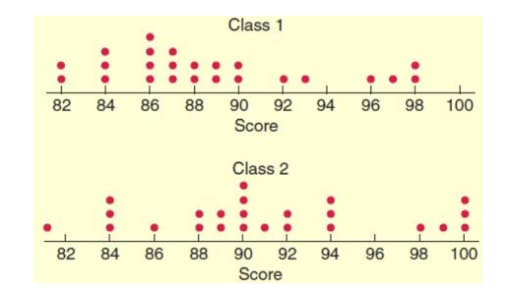
What class has overall better grades?
What is class 2?
400
How does theoretical probability become closer to experimental probability? What must happen?
What is "more trials need to be conducted"?
500
What is the 5 number summary for the boys height box plot below?
What is minimum: 61, Q1: 65, median: 66, Q3: 70, and maximum: 73?
500
Mallory wants to conduct a survey to learn the favorite candy of the students at her school. In order to get an unbiased sample, who should she survey?
A. Her friends who work at the candy shop.
B. Her family members
C. The students in her homeroom
D. Every 7th student who enters the cafeteria during lunch for all grade levels
What is D?
500
7th Grade Math is the BEST Subject at BCMS. True of False?
What is TRUE!!!!
500

Do children or adults have a greater variability in the amount of sugar they eat?
What is their variability is about the same?
500
A set of 25 counters are numbered 1 - 25. Suppose you draw one without looking. What is the probability of choosing a number 10 or less?
What is 2/5?