Mixer
Populations and Samples
Analyzing Data
Comparing Populations
Test Quest
100
Find the different in medians.

172-166=6
100
What is the population of the following:
A: Your school
B: Voters in NC
A) all students enrolled in RMS
B) People 18 and over in NC
100
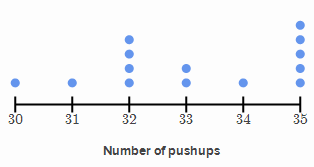
Leah says the mode is 5. Is she correct? Why or why not?
No, the mode is 35.
100
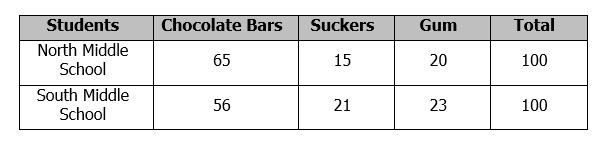
Which school should buy more suckers?
South Middle School
100
The author of some young adult books wants to know more about the kinds of books his readers prefer. Which of the following describes the best sampling of readers for the author to use in a survey?
A. 5000 customers at Walmart
B. 5000 librarians
C. 5000 young adults at the mall
D. 5000 middle schoolers in the city
D
200
Which dot plot has more variability? Why?
Girls, because the dots are more spread out.
200
Is this a biased or random survey:
Ms. Bowen asking her students if math is their favorite subject
Biased.
200
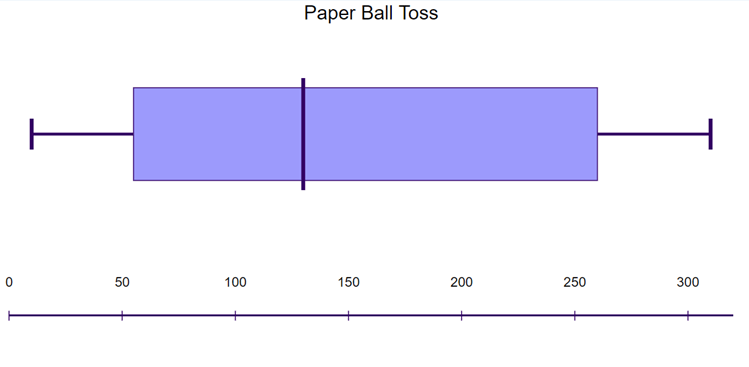
What is the best estimate for the center of this box plot?
Anywhere from 100-150. Probably a little closer to 150.
200
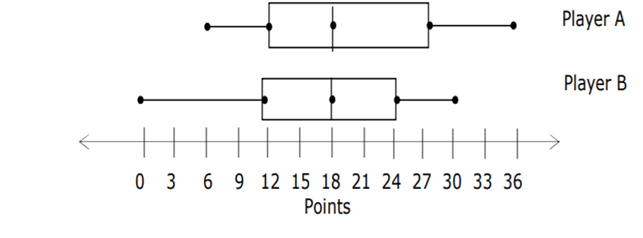
Which is supported by the data in the table?
A) Player A has a larger center than Player B
B) Player A is a better basketball player than Player B
C) Player A had at least one higher scoring game than Player B.
C
200
What is the difference between the mean of London and New York?
13,552.75-12,037.75=1515
300
What is another word for "spread" of data?
RANGE!
300
Is this a random or biased sample?
Going to bingo night and surveying senior citizens on their favorite video game
Biased
300
How do I find the interquartile range on a box plot?
Subtract the ends of the boxes.
300
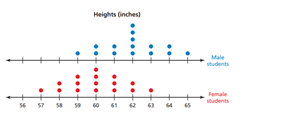
Who has a higher center height? Why?
Boys. Their center height is 62, girls only have a center height of 60.
300
The North Carolina Education Board wants to know what middle schoolers in NC have to say about school life. Should they survey 7th graders at Riverwood Middle School? Why?
No. For it to be valid information, they need to survey middle schoolers of all grades and from different schools in the state.
400
What is the difference in medians?
5.2-4.5 = 0.7
400
A city council member wanted to know how her constituents felt about a planned rezoning. She randomly selected 75 names from the city phone directory and conducted a phone survey.
What is the population?
Everyone listed in the directory
400
If 12 out of 100 seventh graders hate pizza, how many seventh graders would hate pizza out of 300?
36
400
Which class has greater variability?
1st Period. The scores are more spread out visually and the range is larger.
400

1 inch
500
Imagine a researcher wants to study the satisfaction of employees at a social media marketing company with 1,000 staff members. Surveying all employees would be time-consuming and costly. Instead, the researcher can select a sample of 100 employees to represent the population. If 62% say that are very satisfied with the work environment, how many people would you predict to say the same out of the whole population?
620
500
Is this a biased or random sample?
Asking every 5th student in the 6th, 7th, and 8th grade hallways what their favorite enhancement is.
Random
500
In a survey, 3 out of 25 students said that they like raisins. If there are 200 students in the school, how many can we expect not to like raisins?
176
500
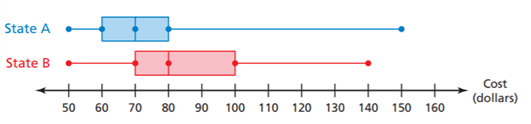
This box plot shows the cost of speeding tickets in 2 states. Julia got a $90 speeding ticket. Which state did she most likely get this ticket in? Why?
State B. The costs are generally higher. They have a mean of 80. Most of the data is between 70 and 100 in State B.
500
Find the mean absolute deviation for the numbers [2,7,15,22]
7