Name two types of variables.
Independent variable
Dependent variable
Control Variable
Name one advantage of using the metric system.
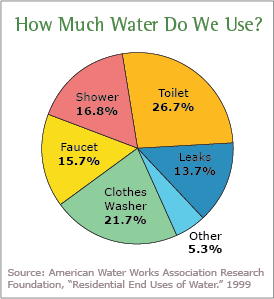
The following is what type of graph? 
Circle graph, or pie chart.
The following picture shows what piece of safety equipment, what is it used for?

Goggles, to protect your eyes.
False
What are the two types of data that can be collected from an experiment?
Qualitative Data
Quantitative Data
Name 2 of the 4 base units we discussed in class.
Liter
Meter
Gram
Celcius
Which type of graph best represents data over a given amount of time?
Line graph
Anytime there is an incident of any kind in the lab, the first thing you should do is?
Tell your teacher.
True or False:
It is okay to take your safety goggles off if you are done with your experiment in the lab.
False
Name the 6 steps of the scientific method.
Observation, Research, Hypothesis, Experiment, Conclusion, Share Results
Convert 22.22 L to mL.
22,220mL.
Identify the dependent variable in the following graph.

Number of vandals.
Is the following an example of a safe or unsafe lab scenario:
Mike and Colleen had a lot of a chemical left from their investigation. They dumped the chemical in the sink and left the water running in the sink as they left class.
Unsafe.
Maddie's brother thought that crushed ice would keep his soda cooler than whole ice cubes.
To test this idea, Maddie divided a large bottle of soda equally among six glasses. Maddie added five whole ice cubes to each of the first three glasses while her brother crushed five ice cubes into small pieces before adding them to each of the other three glasses. Ten minutes after all the ice had been added to the glasses, Maddie used a thermometer to measure the temperature of the soda in each glass.
Identify the dependent variable.
The temperature of the soda.
Identify the independent and dependent variable from the following scenario:
Mosquito repellent is sprayed on one arm, while the other arm is not sprayed with mosquito repellent. The number of mosquito bites is counted after two hours.
Independent: sprayed/not sprayed
Dependent: Number of bites.
Select 3 measuring tools you learned about in class and:
Name them.
Tell me what they measure.
Tell me the units you would use.
Which type of graph would be the best to use for the following data, then explain how you would set up your graph.

Bar graph, caffeine drink on the x axis and amount of caffeine on the y axis.
Is the following an example of a safe or unsafe lab scenario:
Cindy broke a test tube. Carefully she picked up pieces with one hand and placed them in her other hand. Then she dumped the glass pieces into the wastebasket.
Unsafe.
Write a hypothesis to the following question in the form of an if/then statement.
Does the amount of time watching T.V. affect the reading scores of fourth graders?
Create a testable hypothesis from the given scenario in the form of an if/then statement:
Josiah uses a pencil called Brand A. He has pencil smears on his paper every time he completes an assignment and he hates this! Caleb is using a pencil called Brand B. Josiah notices Caleb never has smears on his paper. Josiah wonders if it's the brand of pencil that's keeping Caleb from getting smears on his paper. He decides to borrow Caleb's pencil and test the brand against his to find out.
Convert 10.32 hg to meters.
You cannot complete this conversion.
Calculate the average age of the first 6 presidents. Round your answer to the nearest year.

58 years old.
Name four unsafe lab procedures going on in the following picture:

Which of the following would be the most appropriate label for the y-axis of this graph if the total number of farmed animals in 2002 was closest to 9 billion?

Number of animals (in millions)