Box Plots
Histograms
Perimeter
Solve for x
100
1. How is range calculated?
2. How can you determine if there is a larger range in a box plot?
1. Range = max-min
2. A greater distance between min and max indicates a larger range.
100
How do I calculate the sample size?
You add the frequencies for each class. (In other words, add up the height of each bin.)
100
How do I calculate Perimeter?
Add all sides together!
100
Simplify :
x+2x-4x+5-4
-x+1
200
What is the median?
The median is the middle value of a dataset when it is ordered from least to greatest. It can also be the average of two middle numbers.
200
1) What is the sample size of the following histogram?
2) Which class of the data contains the highest frequency?

1) n=2+3+4+7+9 = 25
2) 20-25
200
Find an expression, in its simplest form, for the perimeter of this triangle.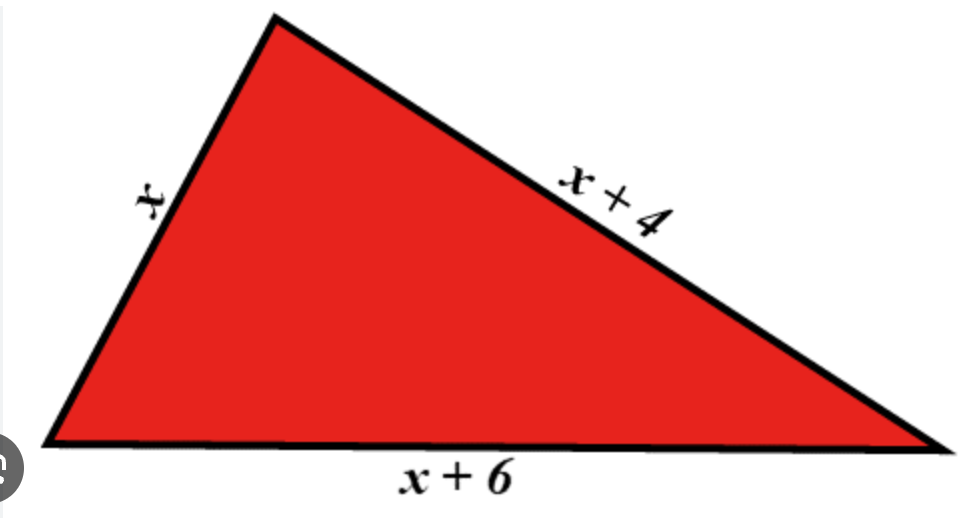
P=(x)+(x+4)+(x+6)
P=x+x+4+x+6
P=3x+10
200
Solve the equation for y.
4x+2y=10
y=-2x+5
300
1. What percentage of the data typically falls between the minimum and Q1?
2. What percentage of the data typically falls between Q1 and Q3?
1. 25%
2. 50%
300
How many classes are in the histogram, and what is the width of each class?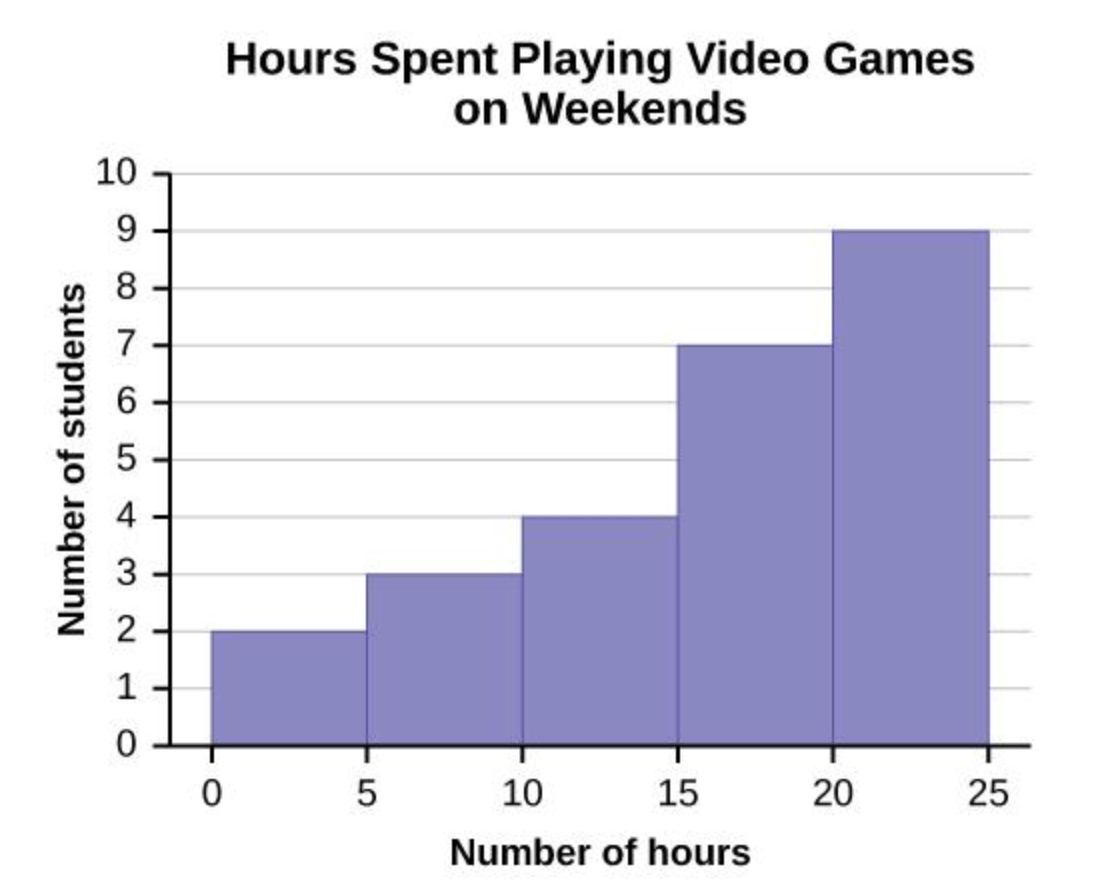
We have 5 classes, with each bin having a width of 5.
300
If the perimeter is 40cm, find x and the missing lengths.
P=3x+10
40=3x+10
x=10
Side 1) x: 10cm
Side 2) x+4 : 14cm
Side 3) x+6 : 16cm
300
(2x+5)/(3)=-3
x=-7
400
Which Team had the higher median?
What percent of players scored more than 10 goals in team 2?
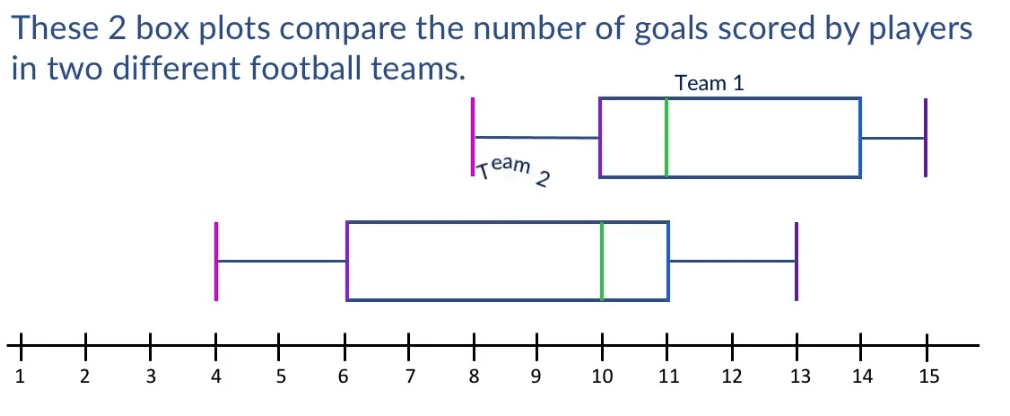
1) Team 1!
2) 50%
400
How many students played 10 hours or more of video games?

20 students
400
2(x-1)+3-x=8
x=7
500
Find the five-number summary for this data set:
25, 27, 32, 34, 36, 38, 41, 43, 46, 49, 52, 54, 59, 61, 63.
Five-Number Summary:
- Minimum: 25
- Q1: 34
- Median: 43
- Q3: 52
- Maximum: 63
500
Describe the shape!
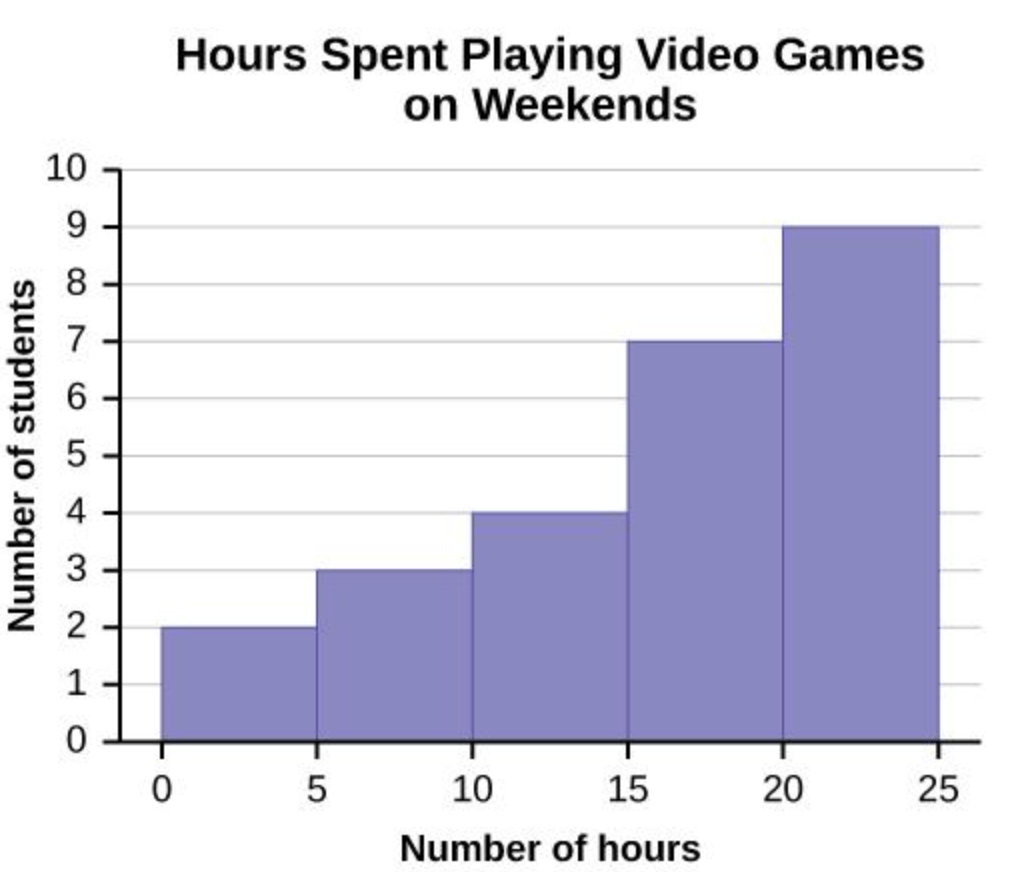
SKEWED LEFT (TAIL IS ON THE LEFT)
500
The equation shown below has a missing value. For what missing value is the equation an identity?
-8x+10=-4(2x- ( ? ) ) +2
? = 2