A-B-C it
Measurement Lingo
According to the task list
Analyze the data
FINAL JEOPARDY
100
Collect ABC data on the boys behavior.
Antecedent - Teacher presents student with flash cards.
Behavior - The student swipes the flash cards off the table and says no.
Consequence - The teacher says, "it looks like you might need a break" and gives the student a toy.
100
A continuous measurement procedure where an RBT counts how many times a behavior occurs throughout a session.
What is frequency?
100
Name two ways you can perform Task List A-1: Prepare for data collection?
Make copies of data sheets, gather data collection and intervention materials (e.g., timers, clickers, reinforcers), or log in to CentralReach and open your clients data sheet
100
Visually analyze this graph of a learner's skill acquisition. What does this indicate about the intervention?
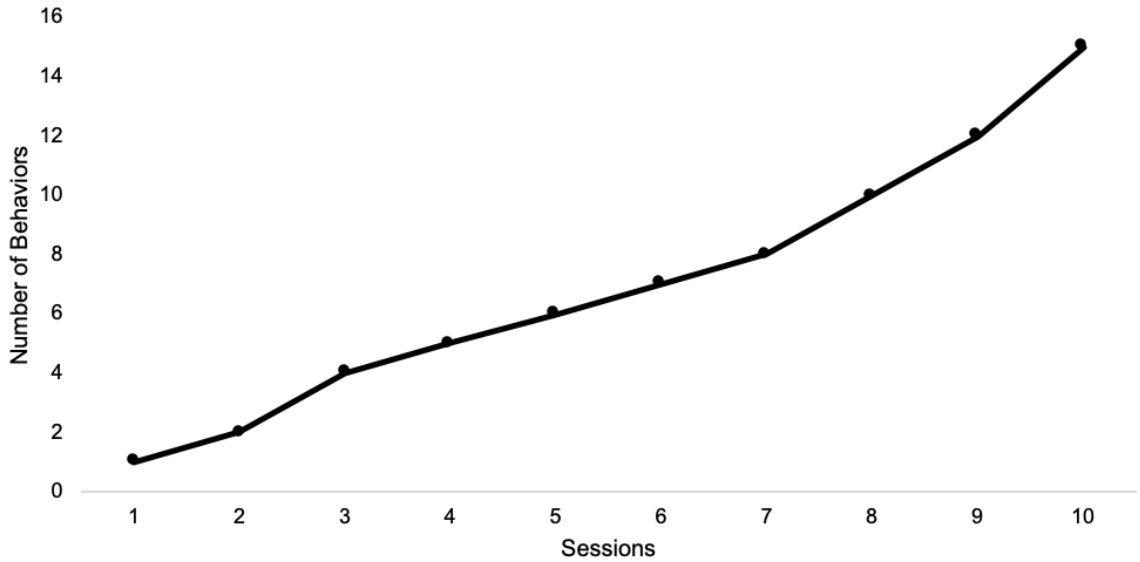
The graph has an increasing trend that indicates that the student is increasing their use of the acquired skill.
100
Fill in the blanks.
Describe behavior and environment in _______(3words)__________ terms.
observable and measurable
200
Collect ABC data on the boys behavior.
Antecedent - Art time ends, it is time for math. Teacher hands the boy a worksheet.
Behavior - The boy rips the worksheet, and yells "I don't want to do math, I don't know math, I hate math"
Consequence - The teacher ignores the boys behaviors, praises the girl for appropriate on-task behavior, and encourages the boy to try again.
200
A measurement procedure where behaviors are only counted if they occur throughout the entire interval.
What is whole interval recording?
200
Examples include tracking the frequency of a students hand raising in class and measuring the duration of time a student is spent reading.
What is Task List A-2: Implementing continuous measurement procedures?
200
Visually analyze the graph of this learner's DRO program. What does the graph tell us about the intervention?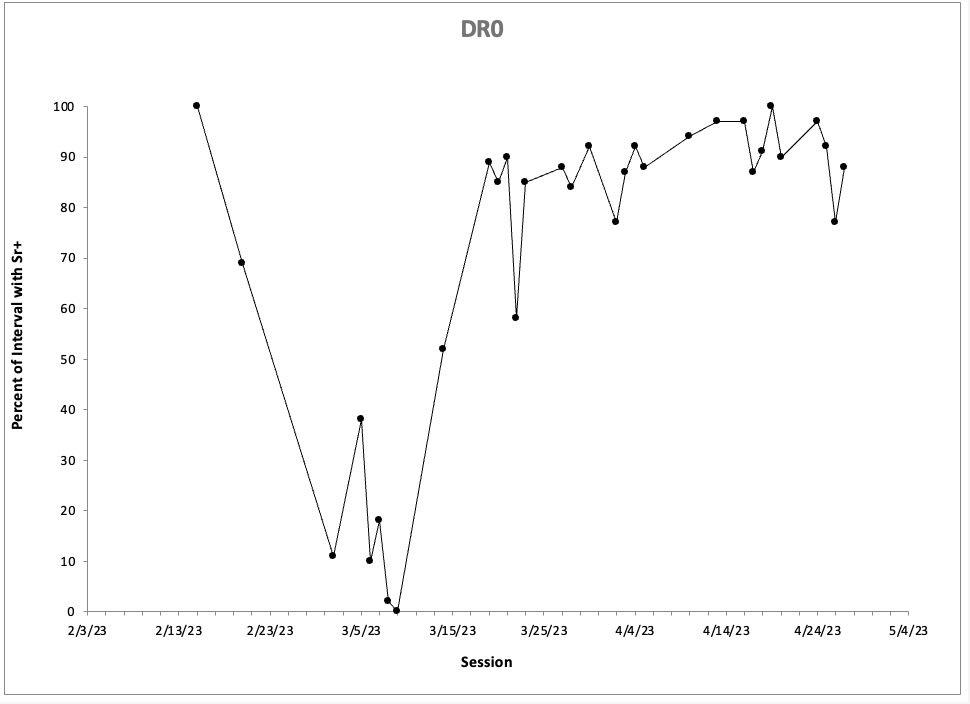
In the first half of the sessions, the learner's response to the DRO intervention was variable, ranging from 0% to 100%. In the second half, the learner's response to the program was less varied, ranging from 75%-100%. This tells us that the learner was probably learning the new DRO contingency in the first half of sessions and became more fluent in the skill as sessions progressed.
300
Collect ABC data on the black cats behavior.
Antecedent - The white and brown cat is slowly swiping toward the black cat.
The Behavior - The black cat swipes back repetitively.
Consequence - Both cats jump away.
300
A measurement procedure that tracks the real or physical outcomes resulting from the behavior.
What is permanent product recording?
300
Name two examples of Task List A-5: Enter data and update graphs.
Examples include taking your paper data and updating the excel sheet for your student, filing your completed data in a learner's file, and rendering your session on CentralReach.
300
Visually analyze the following graphs from ABC data collected for a students problem behaviors. What does this tell us about the hypothesized function of the problem behaviors.
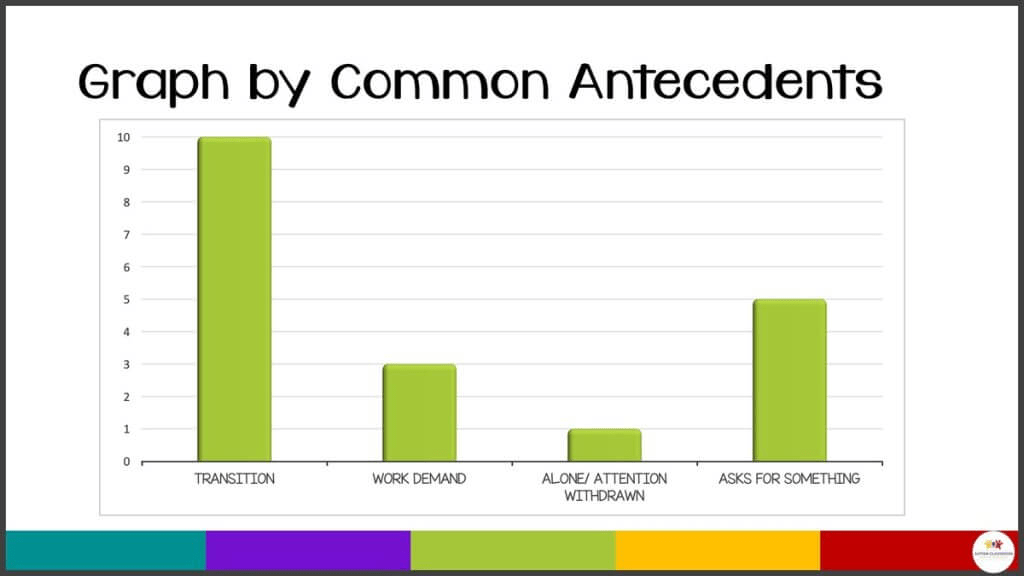
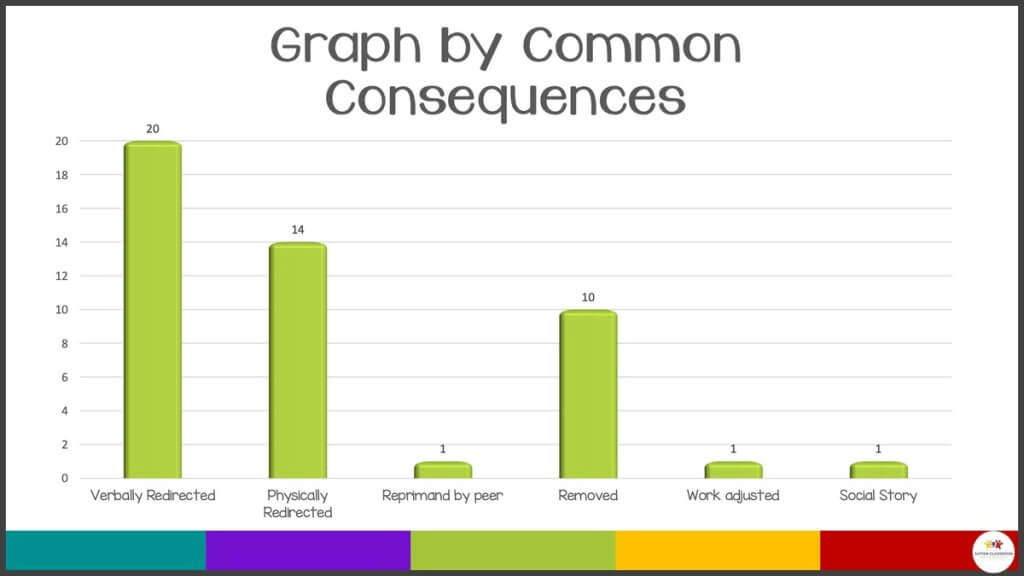
The antecedent graph shows that problem behaviors occurred most often during transitions and sometimes when the learner asks for something. The consequences that often follows problem behaviors are, verbal redirection, physical redirection, and removal. The learner is likely engaging in problem behavior to escape from transitions and gain verbal and physical attention from others.
400
Collect ABC data on the woman's behavior.
Antecedent - The man says he's going to leave and stands up.
Behavior - The woman cries and hits her head with her hand.
Consequence - The man sits back down and continues engaging with the woman.
400
A discontinuous measurement procedure where behavior is marked as having occurred if the behavior happened at any point throughout the interval.
What is partial interval recording?
400
Two examples are collecting data on the number of 10 minute intervals a student engages in hand flapping throughout the day and tracking if a learner is on task at the end of every five minute interval during a 20 minute activity.
What is Task List A-3: Implementing discontinuous measurement procedures?
400
Visually analyze this graph. What does this tell us about this treatment?
The graph shows that the learner's iproficiency in completing task increased from 50% to 75% immediately upon the start of treatment. In later trials, the learner consistently completes the task with 90% correct responding. This tells us that the treatment is effective for teaching the learner this skill.
500
Collect ABC data on the girl's behavior.
Antecedent - Ms. Kate says, "it's time to put away art supplies and do math" and hands the students a worksheet.
Behavior - The girl says, "yes Ms. Kate", cleans up her artwork and starts her worksheet.
Consequence - Ms. Kate praises the girl for getting started with her math.
500
A continuous measurement procedure where an RBT tracks the start and end time of a behavior.
What is duration?
500
Two examples include tracking the number of worksheets a learner completes or documentation of the number of holes a student left in a wall after a tantrum.
What is Task List A-4: Implement permanent product recording procedures?
500
Visually analyze this graph. What does this tell us about the intervention?
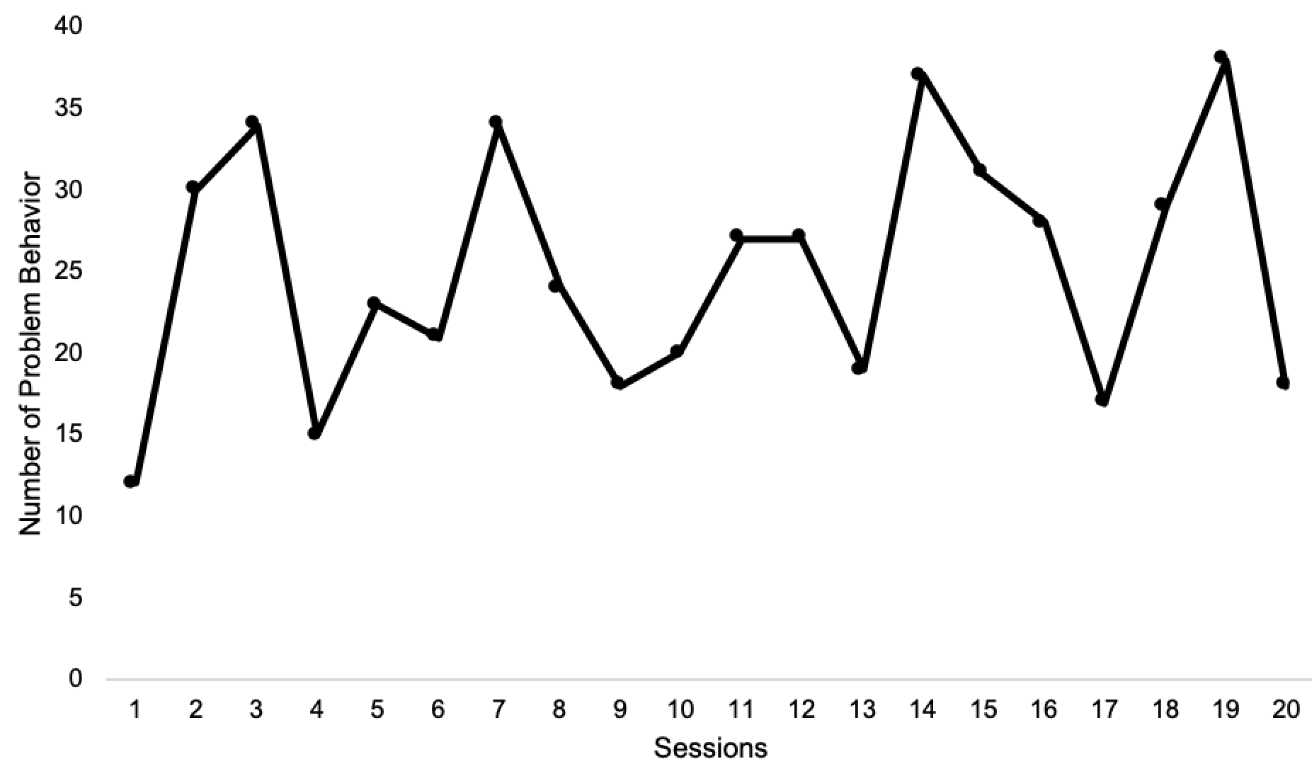
The learner has a high variability in problem behaviors throughout sessions. This indicates that there may be other outside factors controlling the learner's behavior that the intervention does not target.