Data Shapes
Measures of Center
Measures of Variability
Compare Data
Random
100
This data is ....
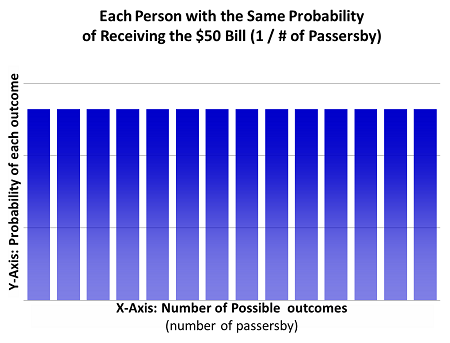
uniform
100
Find the mean of the data set:
3, 6, 8, 10, 12
7.8
100
Find the range of the data set:
3, 6, 8, 10, 12
9
100
Which class has a higher mean? 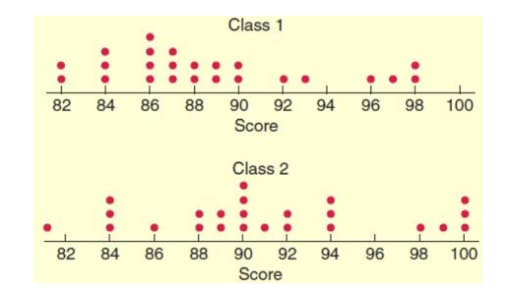
Class 2 (more points to the right)
100
When is the test?
Friday
200
This data is . . .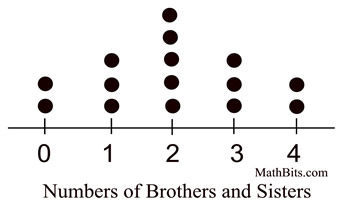
symmetric
200
Find the median of the data set:
3, 6, 8, 10, 12
8
200
Find the IQR of the data set:
3, 6, 8, 10, 12
6.5
200
Which activity has a lower median? 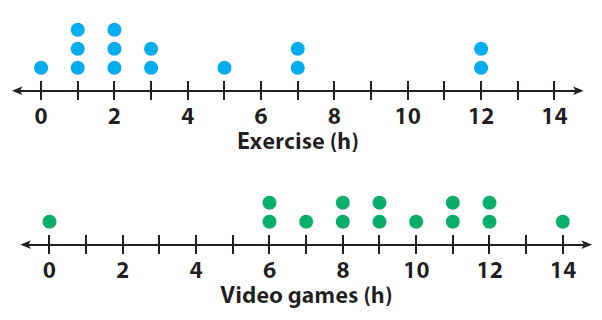
Exercise (more points to the left)
200
When is homecoming?
week of October 5th
300
This data is . . .
skewed right
300
Add a number to the data set that would increase the mean.
3, 6, 8, 10, 12 .... ?
anything over 7.8
300
Find the standard deviation of the data set:
3, 6, 8, 10, 12
3.12 (rounded)
300
Which class has more variability?
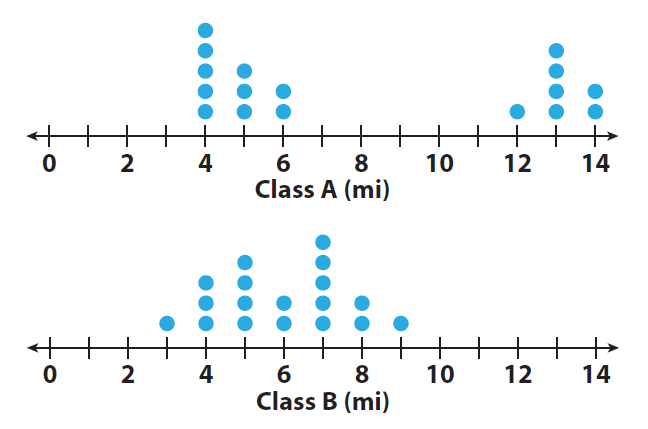
Class A (points are more spread out)
300
Which math teacher dances?
Longnecker
400
This data is ...
skewed left
400
Add a number to the data set that would decrease the mean:
3, 6, 8, 10, 12 ... ?
anything below 7.8
400
Find the IQR:
2
400
Which group has a higher measure of center?

Boys (8) vs 7.47 for the girls
400
What is your graduation year?
2030
500
If comparing these data sets, what measures of center and variability should be used and why? 
median and IQR, since they are skewed
500
Find the mean:
2
500
Find the standard deviation:
1.21 (rounded)
500
Which group has a higher measure of variability?
3.46 (boys st dev) vs 3.32 (girls st dev)
or
6 (boys IQR) vs. 5 (girls IQR)
500
What is the name for the longest side of a right triangle?
hypotenuse