Dot Plots
Box Plots
MMMR
Histograms
IQR/SD
Potpourri
100
What is the RANGE?
6
100
What is the MEDIAN?
31
100
What is the MODE of the given data set?
3, 7, 9, 7, 7, 1, 10, 7, 1, 9
7
100
How many lottery winners were between 50-59 years old?

8
100
What do we call a set of data's "measure of spread"?
Standard Deviation
100
Every odd number contains this letter
"e"
200
Based on this line plot, what is the day when more cars are sold?

Friday
200
Looking at a box and whisker plot; the length of one whisker makes what percentage of the data?

25%
200
What is the RANGE of the data set?
3, 19, 9, 7, 27, 4, 8, 15, 3, 11
24
200
How many lottery winners were at least 60 years old?
9
200
Which group has a smaller standard deviation:
Group A: 9, 3, 7, 4, 1, 6, 4, 1, 9, 15, 6
OR
Group B: 7, 6, 7, 6, 5, 7, 6, 8, 7, 6, 7, 6
Group B
200
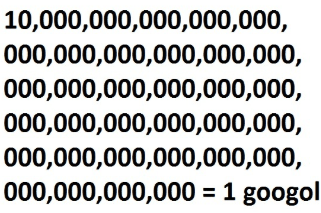
The number 1 followed by 100 zeros is called this
A Googol
300
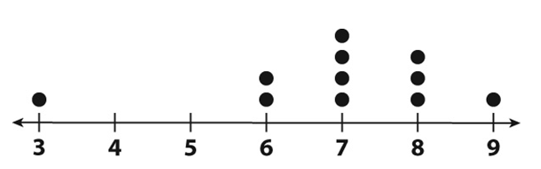
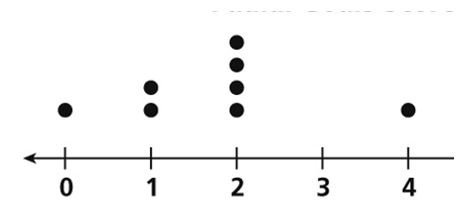
What is the MODE of this dot plot?
10
300
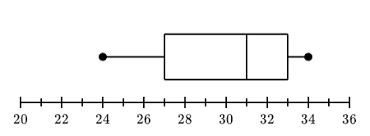
Identify Q1 and Q3.
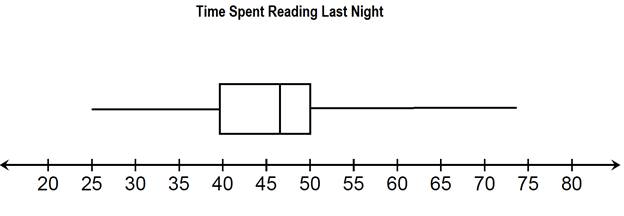
Q1 = 40
Q3 = 50
300
Find the MEAN:
2,3,6,19,28,28,35,29
18.75
300
The histogram below represents a classroom's test scores. How many people took the test?

18
300
How do you find the IQR of a set of data?
IQR = Q3 - Q1
300
Assuming you have a plain, circular pound cake, what is the fewest amount of slices needed to cut it into 8 equally-sized slices?
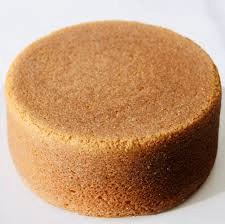
3
400
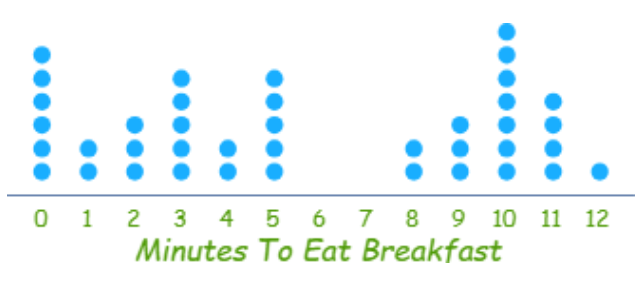
How many people are represented in the following dot plot?
8 people
400
Looking at a box and whisker plot; what percent of the data is to the left of Q3?

75%
400
Find the MEDIAN of the set of data:
10, 5, 9, 8, 3, 2
6.5
400
Find the IQR of the following data: 10, 12, 8, 13, 6, 10, 16
13 - 8 = 5
500
What is the IQR?
IQR = 7