Column 1
Column 2
Column 3
Column 4
Bonus
500
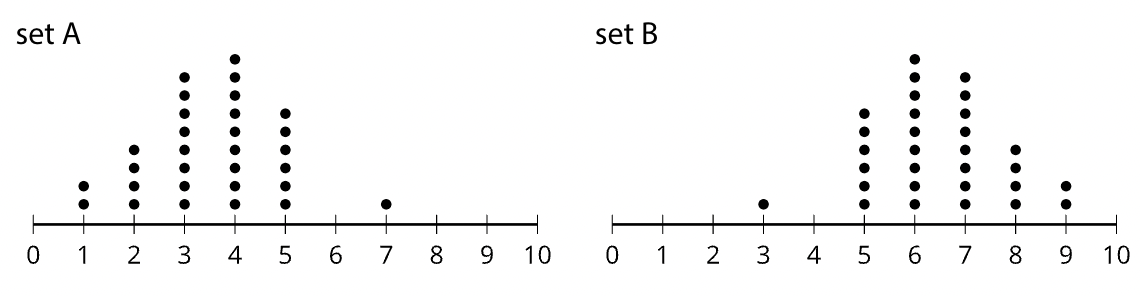
Which set has a higher mean? How do you know.
Which set has a higher standard deviation? How do you know.
The mean of set A is less than the mean of set B, and their standard deviations are the same.
500
In an experimental study, it was noticed that people who eat more leafy, green vegetables tend to get better sleep than the general population. Researchers wonder whether the improved sleep might be caused by the minerals potassium and magnesium found in leafy, green vegetables. How could the researchers design an experiment to determine the effects of potassium and magnesium on sleep?
You could get four different groups of people to study. One group would not eat any green leafy vegetables, the second group would get a potassium supplement, the third group would get a magnesium supplement, and the fourth group would get both a potassium and a magnesium supplement. You could then measure the quality of each group’s sleep from the beginning to the end of the experiment.
500
Here is a histogram of a distribution with 94 data points.
Find the proportion of data points which fall in the interval 47 to 48.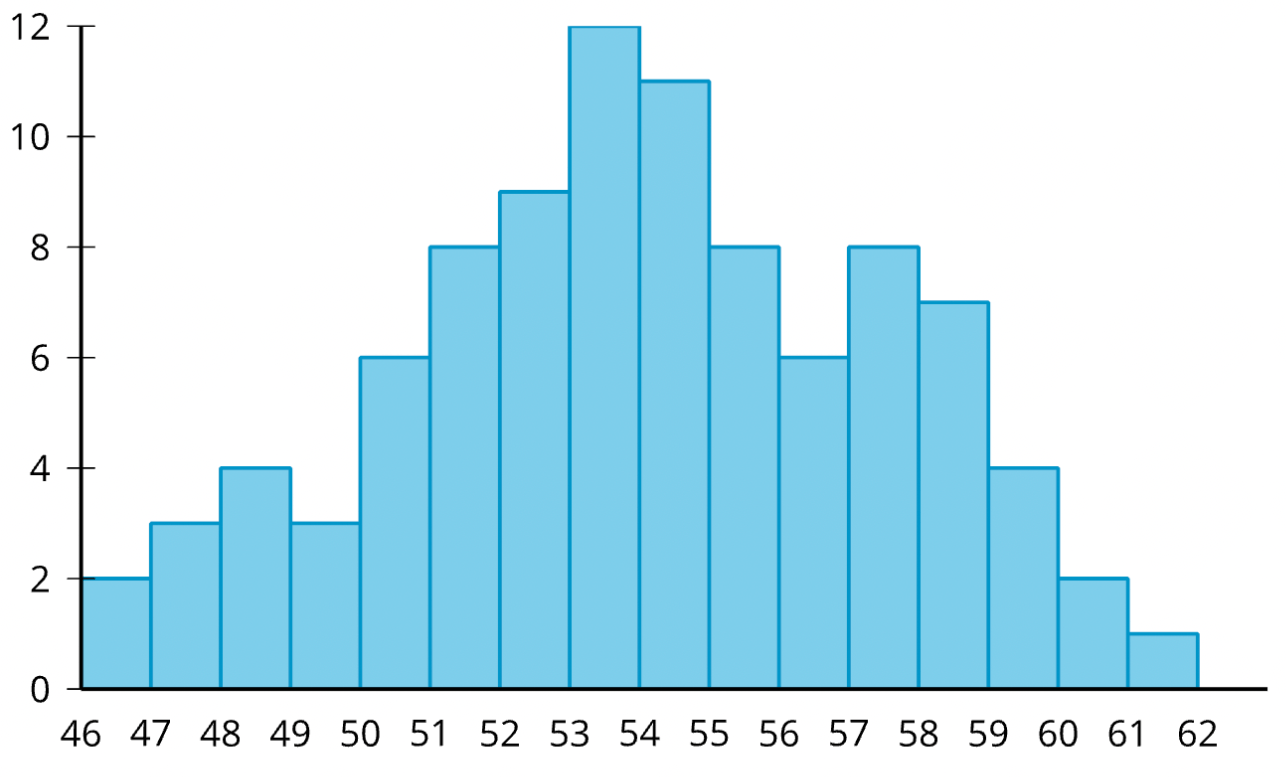
0.0319
500
Here are 2 distributions.
How does the mean of set A compare to the mean of set B? Explain your reasoning.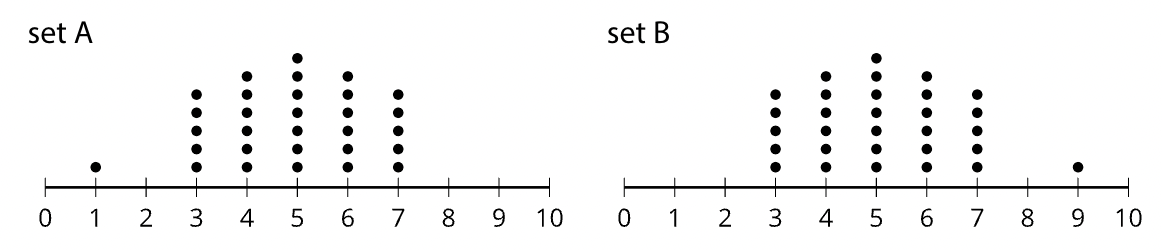
The mean of set B is greater than the mean of set A because all of the values are the same in both sets except the values 1 and 9. Set B has a value at 9 instead of at 1 so the sum of all the values in set B is 8 more than the sum of all the values in set A. Since they have the same number of values the mean of set B must be greater than the mean of set A.
500
Here is a histogram of a distribution with 94 data points.
Find the proportion of data points which fall in the interval 53 to 54.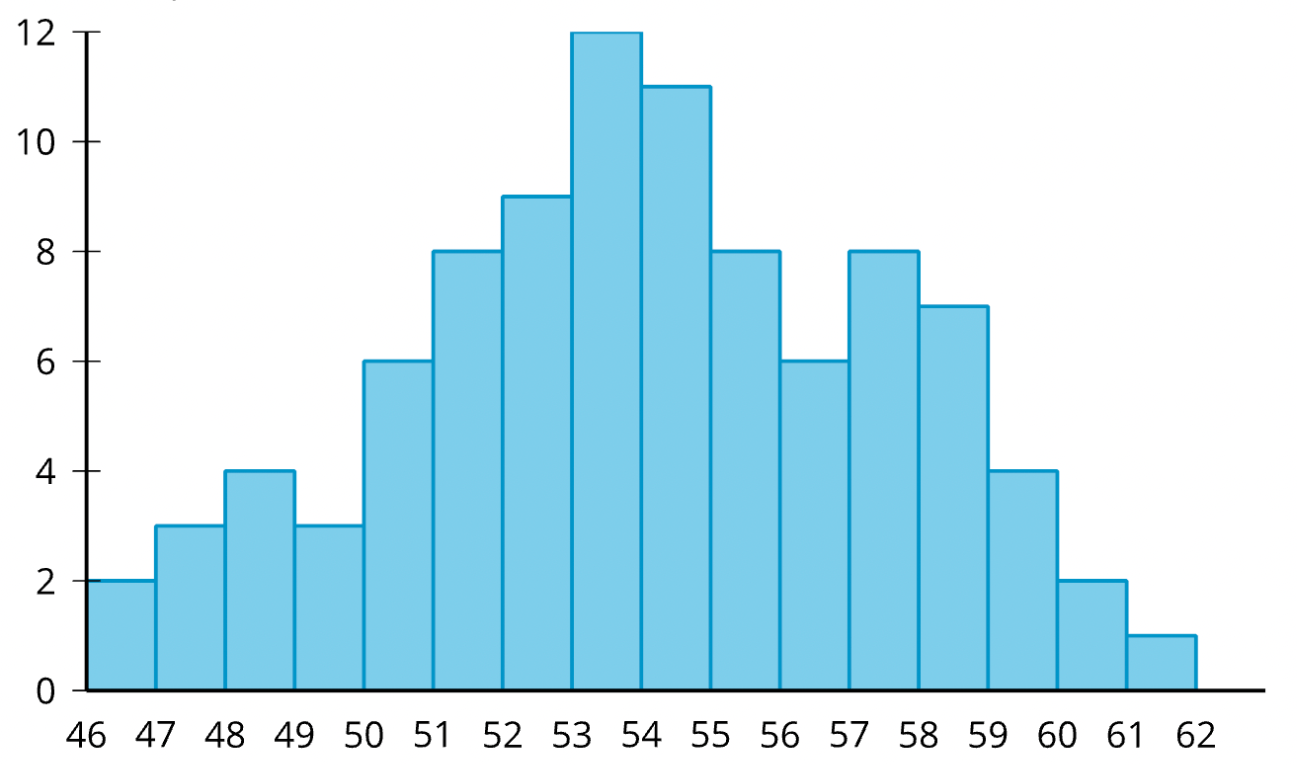
0.1277
1000
Mai collects information about 37 classmates. She believes her data set is perfectly symmetrical with a mean and median of 20. She then realizes that the number she has recorded as 32 was actually supposed to be 42. What is true about the mean and median of her corrected data set?
A: The mean and median of the corrected set are both still 20.
B: The mean of the corrected data set is still 20, but the median is greater than 20.
C: The median of the corrected data set is still 20, but the mean is greater than 20.
D: The mean and median of the corrected set are both greater than 20.
C
1000
Elena is conducting an experiment to determine if high school students are more relaxed when the lights are off or when music is played during an exam. She selects 10 of her friends to take an exam with the lights off and another 10 of her friends to take an exam with music playing. What is problematic about the way that Elena selected her groups?
The participants were not randomly assigned into groups. She only surveyed her friends and not all high school students.
1000
This relative frequency histogram shows the distribution of average daily temperatures (in degrees Fahrenheit) for a town over the course of 5 years.
What proportion of days over the 5 years was the temperature between 60 and 66 degrees Fahrenheit.
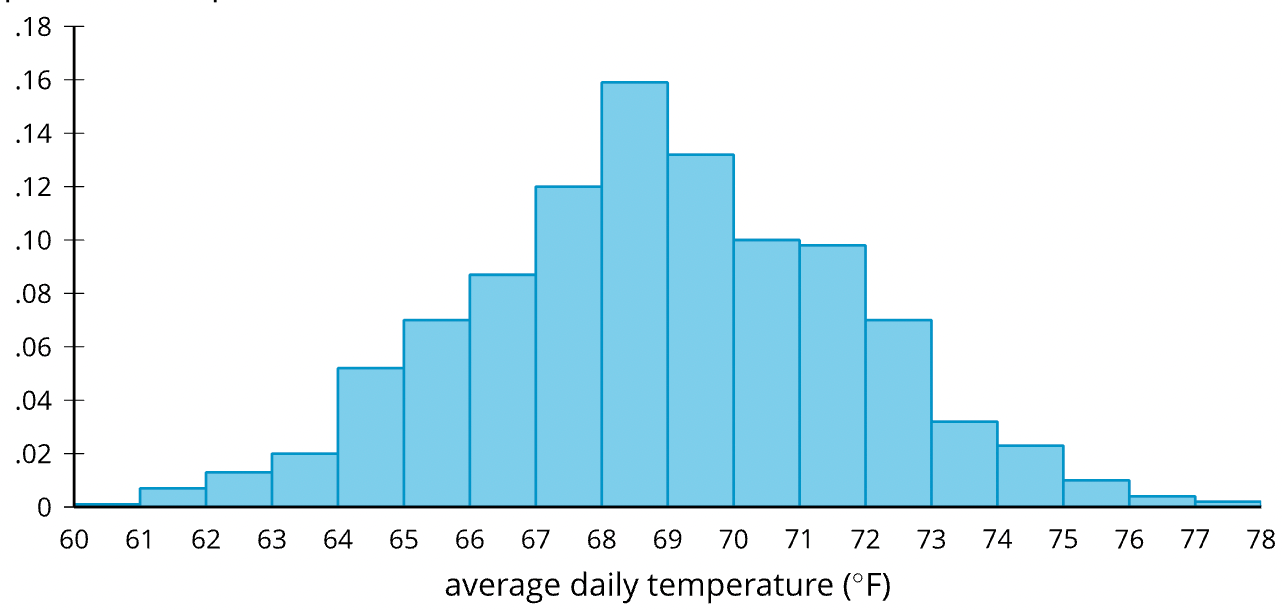
0.163
1000
Which distribution is symmetric?
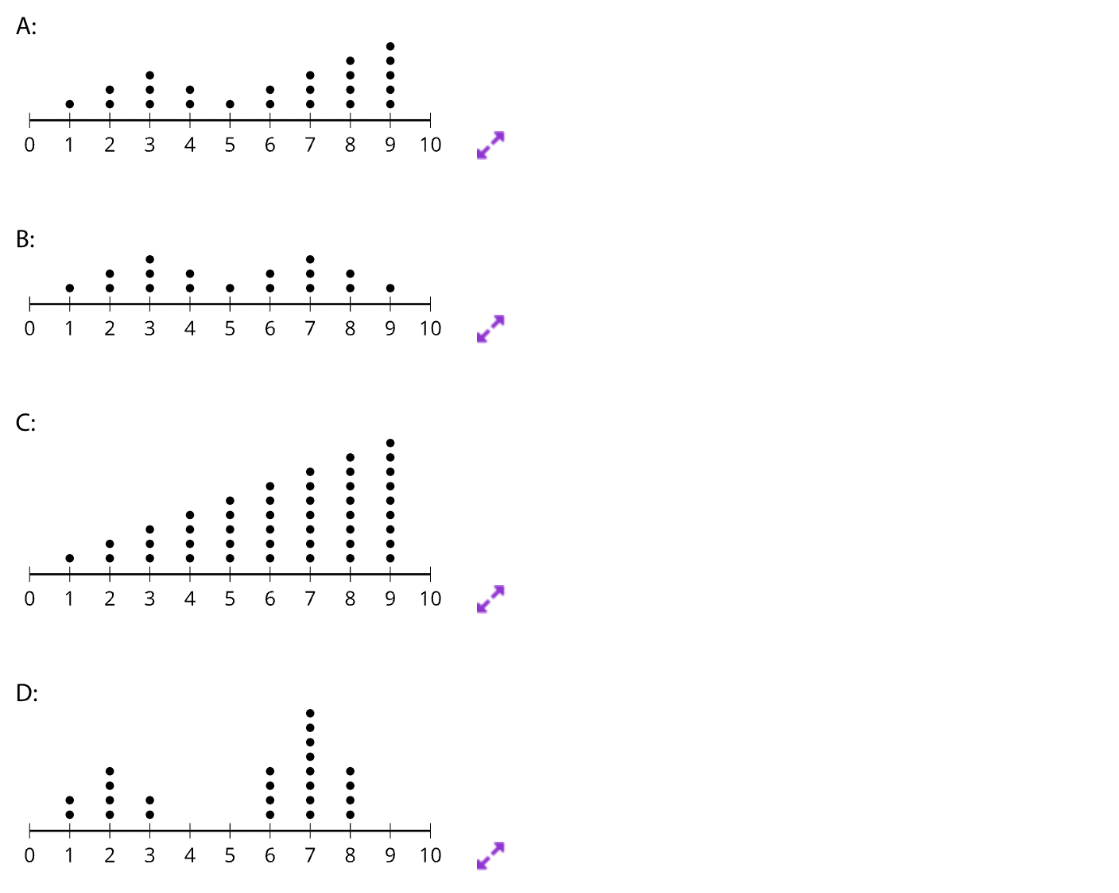
B
1500
Select all distributions which are approximately symmetric.
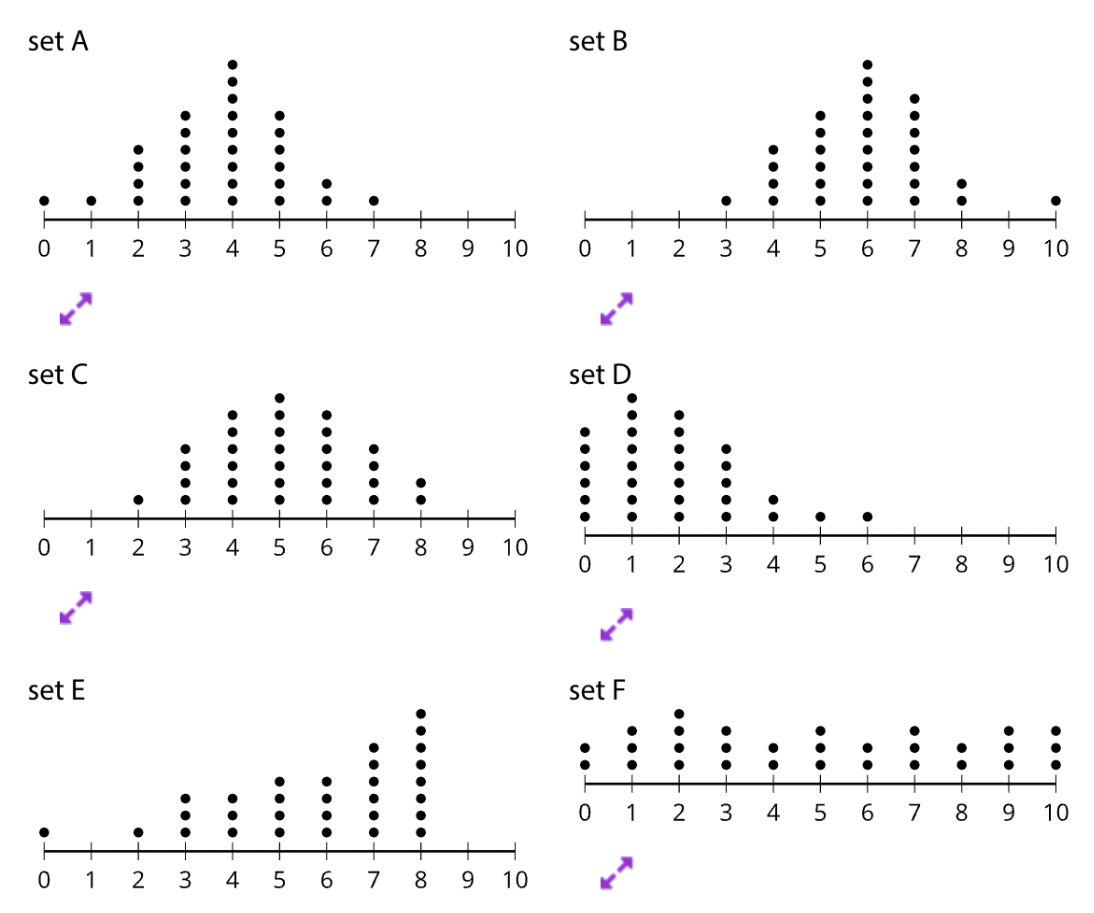
A, B, C, F
1500
An environmental education club has 318 members. Select all methods that would select a sample of 20 members at random from the entire environmental education club.
A: Ask for 20 members to volunteer to take the survey.
B: Place the names of all 318 members on individual slips of paper placed into a bowl. Thoroughly mix up the slips and then select 20 of them.
C: Number the members from 1 to 318. Use a random number generator to make a list of 20 random integers between 1 and 318 inclusive.
D: Select 10 of the younger members at random and 10 of the older members at random.
E: Send a survey to all 318 members and record the results of the first 20 responses.
B, C
1500
Two curves representing normal distributions are shown. Does the solid curve or dashed curve have a greater standard deviation? Explain how you know.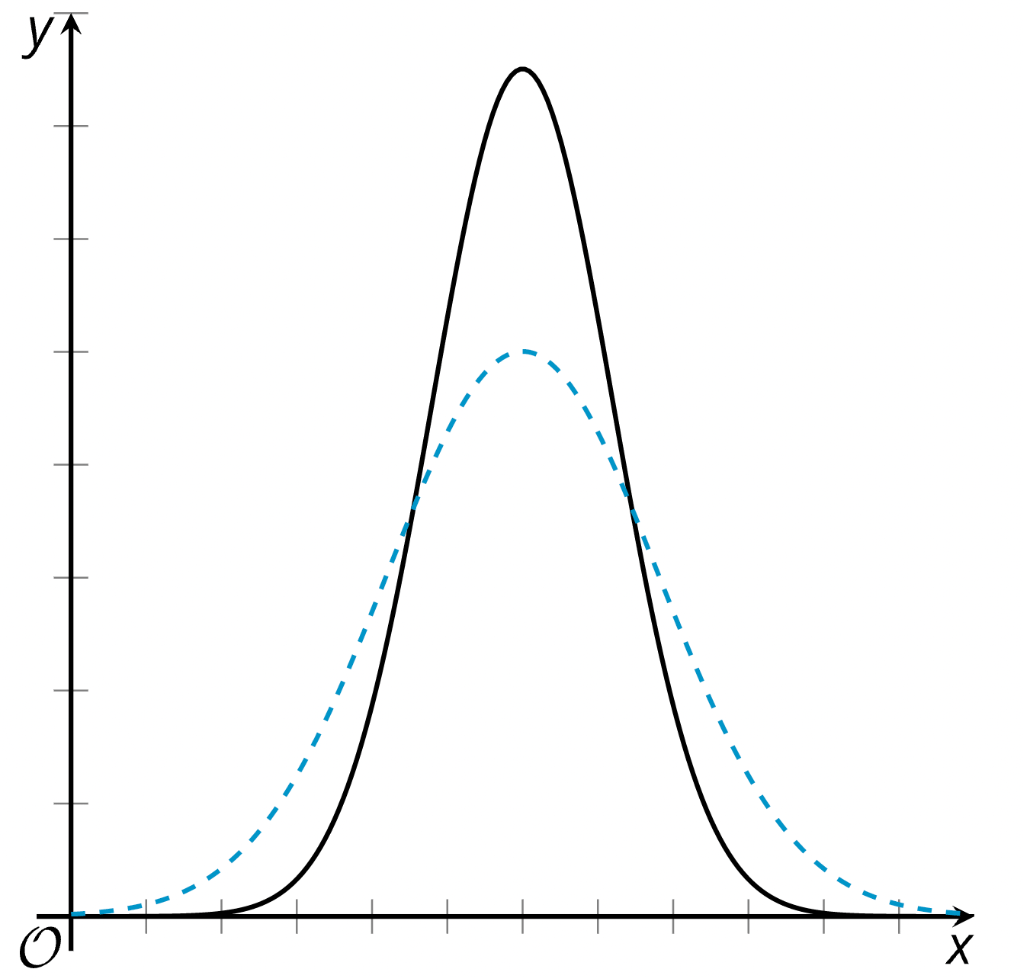
The dashed curve. It is wider and shorter than the other curve.
1500
Clare is designing an experimental study. She says that it is important to randomly assign people to random groups in an experimental study because this helps reduce the likelihood of grouping subjects into groups that may differ on some characteristic that is related to the response of interest. Do you agree with Clare? Explain your reasoning.
Yes. Clare is correct because randomly assigning people to random groups means that you are leaving any difference in the groups to chance not some other factor.