Measures of Center
Measures of Variation
Appropriate Measures
Graphs
Planets
1
Find the mode of: 10, 20, 15, 11
What is there is NO MODE.
1
Find the range of: 10, 6, 11, 14, 25, 13
What is 19?
1
Which measure is most affected by an outlier, the mean or median?
What is mean?
1
Which graph shows frequency of data divided into equal intervals?
What is histogram?
1
The third planet from the sun.
What is Earth?
100
Find the median: 8, 22, 15, 11, 10
What is 11?
100
Name any outliers: 10, 37, 42, 38, 75, 40, 33
What is 10 and 75?
100
When do you use the mean vs. the median for "choosing appropriate measures"?
Mean = When the data distribution is symmetric
Median = When the data distribution is skewed
100
Which graph shows change over a period of time?
What is a histogram?
100
The second planet from the sun.
What is Venus?
500
Find the median and mode: 25, 16, 18, 16, 24, 30
What is median 21 and mode 16?
500
Find the first and third quartiles : 12, 10, 14, 16, 8
What is Q1 = 9 and Q3 = 15?
500
Which measure of center best represents the data? Then find the measure of center.
22, 14, 22, 14, 20, 30, 40, 50, 45, 60
What is Median = 26?
500
Which graph allows you to calculate the IQR easily?
Box and whisker plot
500
The fourth planet from the sun.
What is Mars?
1000
Find the mean of: 10, 15, 22, 30, 45
What is 24.4?
1000
Find the interquartile range: 10, 6, 22, 12
What is IQR = 9?
1000
Find the mean of : 30, 40, 20, 100, 400
What is mean = 118?
1000
Which graph allows you to analyze the data distribution in intervals of 25%?
Box and whisker plot
1000
The seventh planet from the sun.
What is Uranus?
5000
Mr. Santiago bowled 150, 148, 177 and 184. If he wants to average exactly 172, what must he bowl on the next game?
What is 201?
5000
Thinking of the 5-number summary, find the measures of variation.
17, 52, 22, 43, 41
IQR = 28 and Range = 35
5000
Find the mean with and without the outlier:
50, 60, 70, 80, 200
What is mean with outlier = 92?
What is mean without outlier = 65?5000
Describe the distribution of the three histograms, A, B and C below.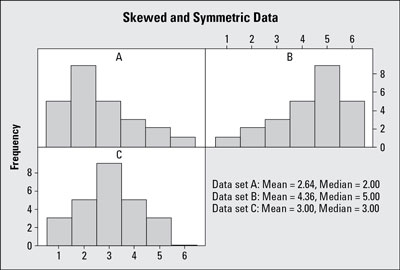 below.
A: Skewed Right
B: Skewed Left
C: Symmetric
5000
The ninth planet from the sun.
What is Pluto?