Measures of Center and Variation
Box-and-Whisker Plots
Shapes of Distributions
Two-Way Tables
Vocabulary
100
Find the mode of the data set:
7, 8, 10, 22, 6, 4, 8, 10, 4, 3, 1, 10
What is 10?
100
Looking at the box and whisker plot: Find the median.

What is 85?
100
Describe the distribution.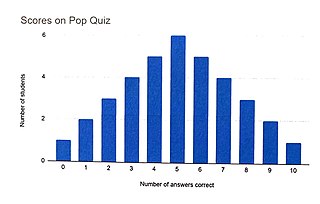
What is symmetric distribution?
100
The total number of males and females that participated 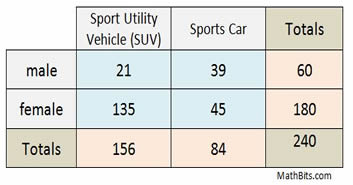
What is 240?
100
This makes the data value that is either much greater or less than the other values in the set.
What is an outlier?
200
Find the median of the data set:
22, 24, 15, 18, 40, 23, 22, 17, 21, 20
What is 21.5?
200
The dot represents ____ in the data and state its approximate value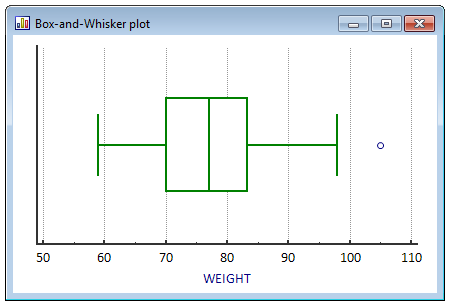
What is an outlier and 105?
200
Describe the shape of the distribution
What is skewed left?
200
Calculate the percentage of people who like football who like chocolate. Round to one decimal place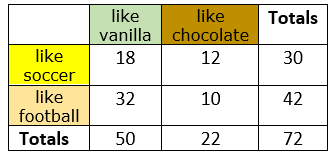
What is 45.5%
200
The values of the box-and-whisker plot summary are described as.
What is the five-number summary?
300
Find the mean of the data set:
9, 18, 20, 25, 1, 89, 55, 20, 67
What is 33.8?
300
Companies A, B, and C are plotted, and which company has the greatest skew.
What is company A?
300
Say the average height of a black cherry tree is75 ft, so interpret the result of this data set. (number of trees at the height or taller).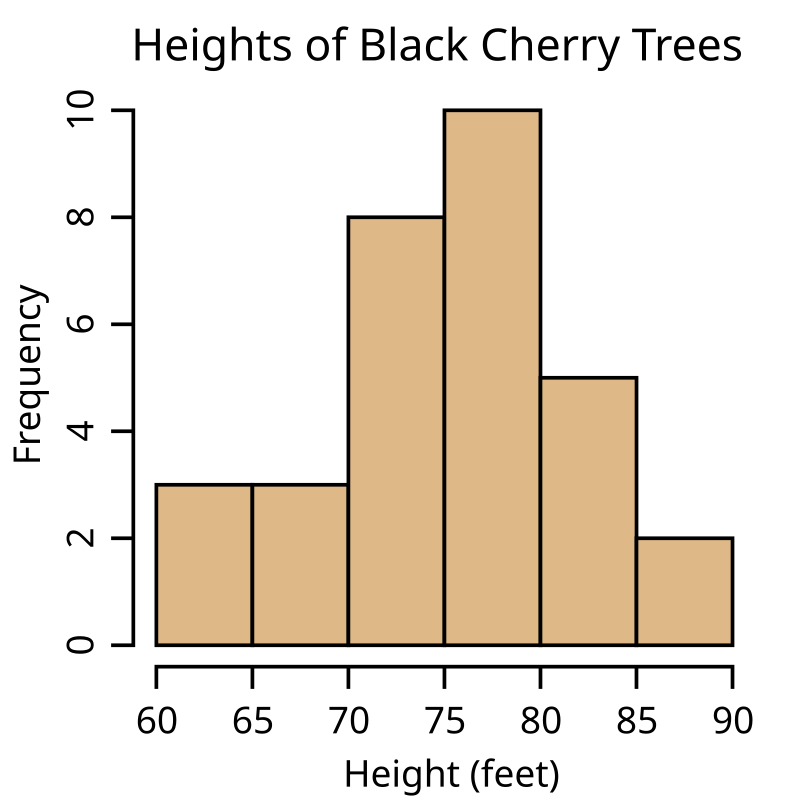
What is 17 are at or above average?
300
Find the conditional frequency of being Female and Righthanded percentage. Based on the column totals

What is 42%?
300
When a distribution is ____, the mean and median are about the same.
What is symmetric?
400
Find the range of the data set:
90, 159, 87, 32, 87, 160, 102, 89
What is 128?
400
Find the IQR of the plot
What is 40?
400
How many times greater is the IQR of the boys than the girls?
What is 5?
400
Find the conditional relative frequency based on the row total of having no car and having a driver's license.
What is 45%?
400
The sums of the rows and columns are ____ in a two-way table.
What is marginal frequencies?
500
Find the Standard Deviation of the set:
25, 20, 22, 27, 48, 32, 19, 27, 25, 22, 21, 24
Given the mean = 26
What is 7.47?
500
Data set that is more spread out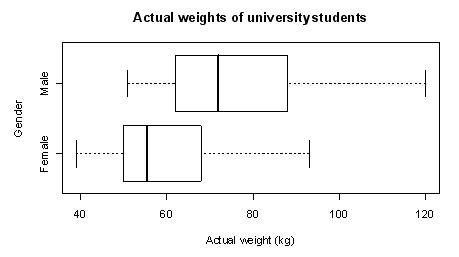
What is male weight?
500
Which histogram has more variety in the data?

What is histogram A?
500
You survey students and find that 35% exercise regularly 25% eat fruits and vegetables each day, and 50% do not exercise and do not eat fruits and vegetables each day.
Find the percent in the Yes and Yes: so exercise regularly and eat fruits and vegetables.
What is 10%?
500
A ____ is a statistical graph that is not drawn appropriately.
What is a misleading graph?