Mean, Median, Mode, and Range
Box & Whisker Plots
Histogram / Frequency Tables
Two Way Tables...Placing a number
Two way tables...Finding a Number
Two way tables... % quesitions
100
Find the mean and mode of this set:
3,5,7,7,8,8,8
Mean: 6.6
Mode: 8
100
What five things do we display in a box and whisker plot?
Minimum, Q1, Q2 (Median), Q3, and Maximum
100
How many lottery winners were between 50-59 years old?

8
100
Place the Number: 200 students participated in the survey.

I
100
Solve for A:

12
100
What is the percentage of a student has no curfew?
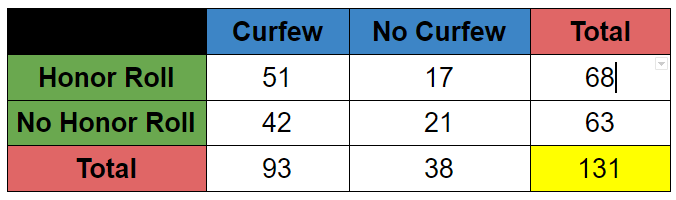
38/131
29%
200
Find the mode and range of this set
3,4,4,5,6,7,8,9
Mode: 4
Range: 6
200
What forms the whiskers of a box and whisker plot?
The minimum and maximum
200
What is the most common age group?
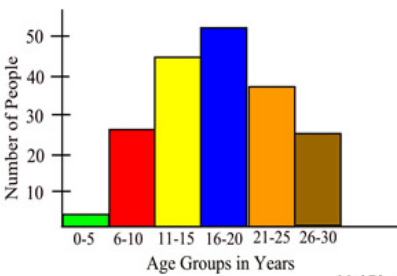
16-20
200
A total of 110 students doesn't play an instrument.

H
200
Solve for B:
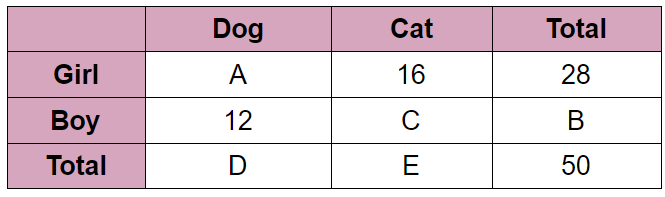
22
200
What is the percentage that a student who is on the Honor Roll has a curfew?

51/68
75%
300
Find the mean and median of this set?
3,4,5,6,7,8,10
Mean: 6.1
Median: 6
300
Create a box and whisker plot out of the data:
2, 8, 5, 6, 12, 15, 3, 10, 4, 14, 20, 0
Minimum = 0
Q1 =3.5
Median = 7
Q3 = 13
Maximum= 20
300
The histogram below represents peoples test scores. How many people took the test?

18
300
48 girls play an instrument.

D
300
Solve for C:
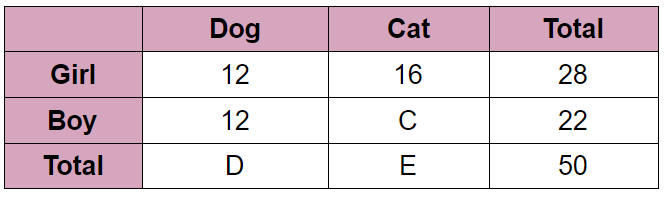
10
300
What is the percentage that a student has a curfew and are not on the honor roll?
42/93
45%
400
What is the range, mean, median, and mode of this set:
20, 30, 45, 50, 50, 80, 509
Mean:112
Range: 489
Mode:50
Median: 50
400
Create the box and whosker plot for the following data set:
1, 3, 3, 4, 7, 12, 15, 16, 16
min - 1
Q1 - 3
Median - 7
Q3 - 15.5
max - 16
400
How many people got between an 80-119?

12
400
70 boys do not play an instrument.

B
400
Solve for D:

24
400
What is the percentage that a student who doesn't have a curfew is on the honor roll?
17/38
44.7% or 45%
500
What is the mean, median, and mode of this set:
3,4,5,2,1,1,1,1
Mean: 2.25
Median: 2
Mode: 1
500
What is the IQR for the following data set:
2, 6, 1, 0, 2, 3, 10, 8, 5
7 - 1.5 = 5.5
500
What percent of students to the nearest tenth scored above 119?
41.9%
500
112 total boys took the survey.
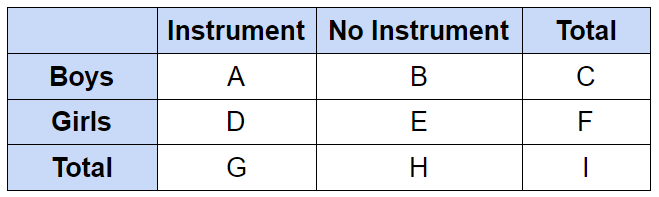
C
500
Solve for E:
26
500
What is the percentage that a student is not on the honor roll?
63/131
48%