Data Analysis and Statistics
Number Systems
and Expressions
and Expressions
Functions
Linear Equations
and
Inequalities
and
Inequalities
Systems of Equations and Inequalities
Quadratic and Exponential Functions
100
Create a box plot for this of numbers: 4, 8, 1, 6, 10, 5, 12, 3, 1
Show Ms. Cook your box plot!
100
Simplify 6x-8y+3x+7y-4x
5x-y
100
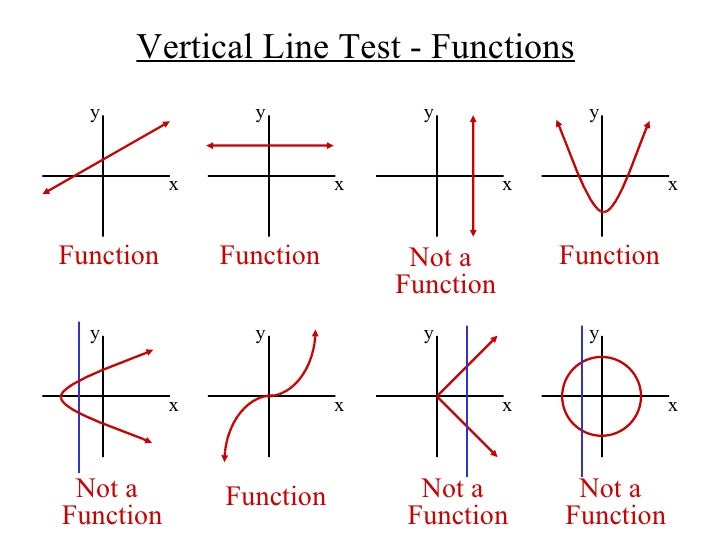
Determine whether each graph is a function or not:
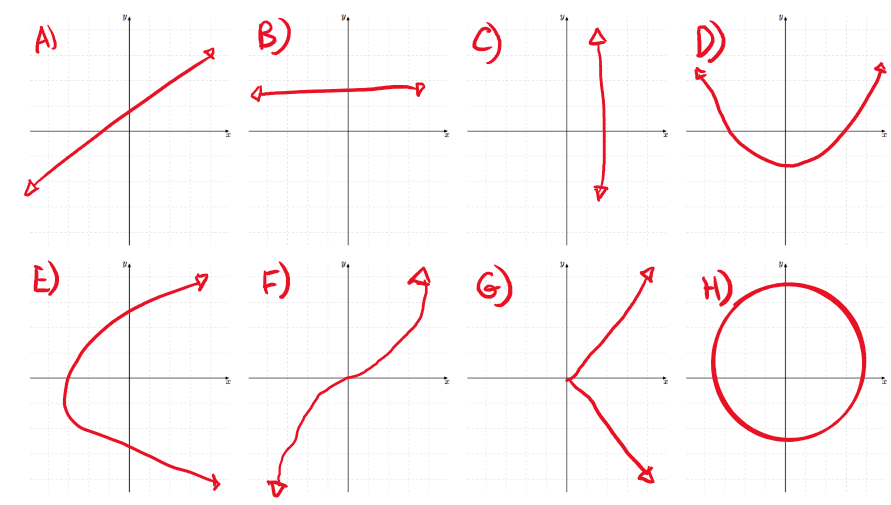
To determine which are and are not a function, we can use the vertical line test.
100
Which graph represents the inequality below
-9x+4y<=8
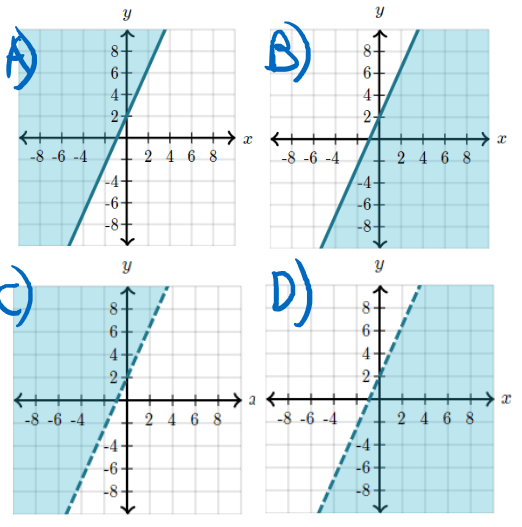
Since the inequality is a <=, the graph will have shading below the line and the line will be solid.
So the correct graph is graph B!
100
Write the inequality represented by the graph below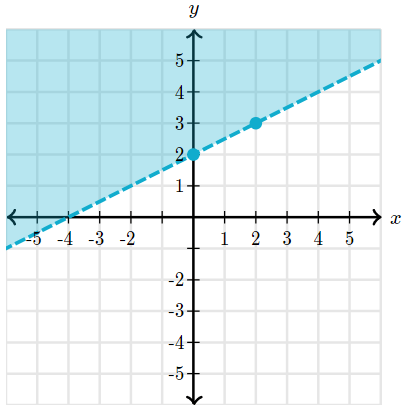
To find the inequality for this graph, we start by noticing the line is dotted and the shading is above the line, meaning we should use a > sign.
Next we can look at the two points (0,2) and (2,3) to find the slope.
(y_2-y_1)/(x_2-x_1)=(3-2)/(2-0)=(1/2)
So after noting that the y intercept is (0,2) we can write the inequality as
y>(1/2)x+2
100
Identify the type of equation (linear, exponential, quadratic, or none) of each graph below:
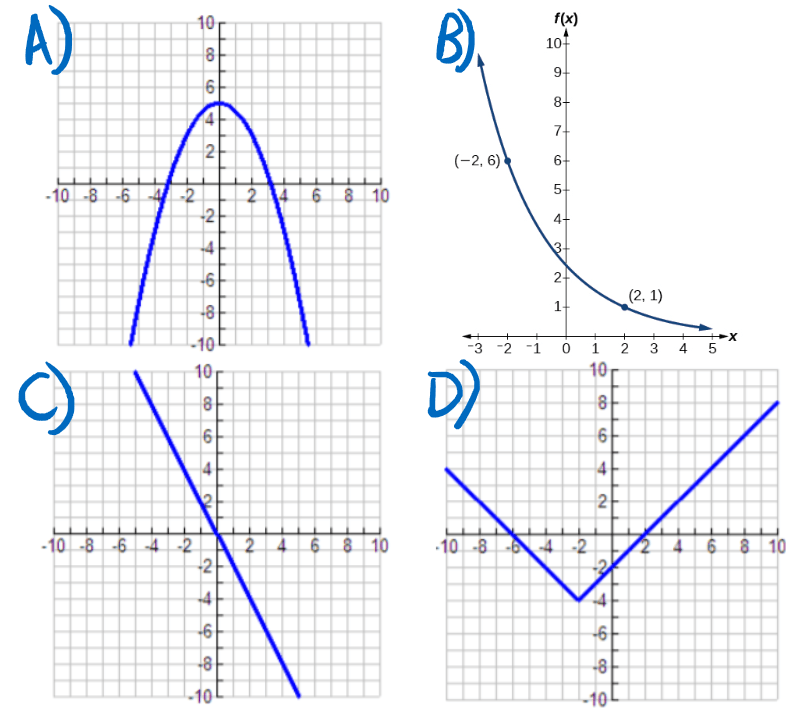
A) Since graph A is a parabola facing downward, we know that it must be a negative quadratic equation
B) Since graph B is a curve that appears to continue to decrease and flatten out, this graph is an exponential decay equation
C) Since graph C is a straight line decreasing from left to right, it is a decreasing linear equation
D) Since graph D has a point where two sides extend straight out and up, this is actually an absolute value equation so the answer is none or absolute value
200
Will the mode or the range change if you take out the outlier: 4, 5, 1, 7, 8, 56, 1
The RANGE will change.
200
Determine whether each number is rational or irrational :
1) sqrt(5)
2) 2pi
3) sqrt(64)
4) pi-1
Since irrational numbers are real numbers that cannot be written as a simple fraction...
1) irrational
2) irrational
3) rational
4) irrational
200
Evaluate the following function f at f(2):
When we evaluate a function, we are finding the value of y when x is the given number.
When x = 2, the function is equal to -2.
So f(2)=-2
200
Solve the linear equation for x:
4x-9x=15
To solve this equation, first we simplify like terms and combine 4x and -9x
-5x=15
Then, we move the -5 over to get x by itself
x=(15/-5)=-3
So our answer is: x = -3
200
Which graph is a representation of the system of inequalities below:
y<3/4x+3
y<=-2x-1
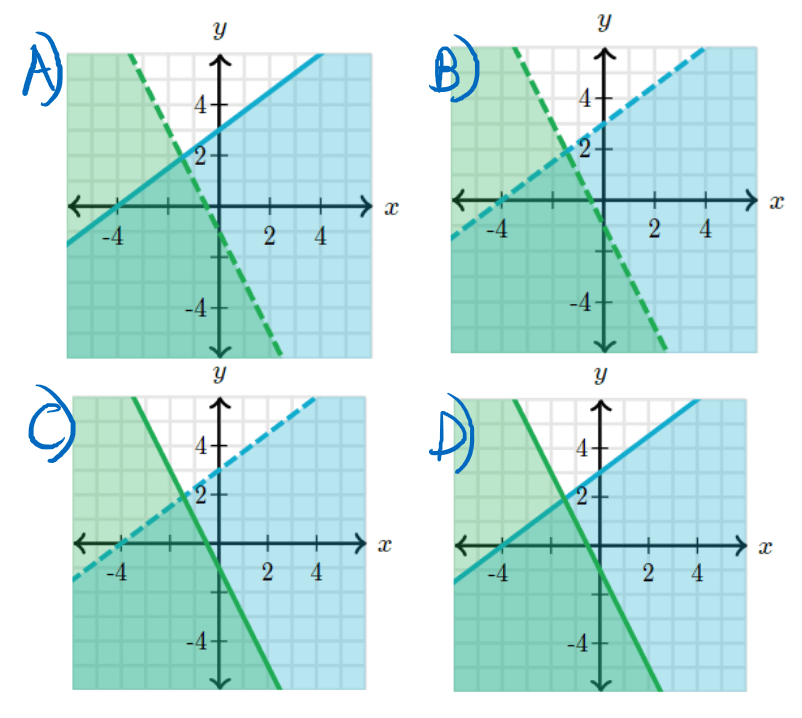
The best thing we can do to distinguish the graphs is look at the inequality signs used. Since the first equation has a less than but not equal to sign, the graph should be a dotted line that is shaded underneath it. For the second equation, we can see that we are using a less than or equal to sign so we need to use a solid line with shading underneath. The graph that shows this is graph C!
200
Use the zero product property to find the solutions to the following equation
(x+6)(-x+1)=0
To find the solutions, all we need to do is set each part equal to 0 and solve for x
(x+6)=0->x=-6
(-x+1)=0->x=1
300
Determine the type of correlation for each graph (positive, negative, or none)
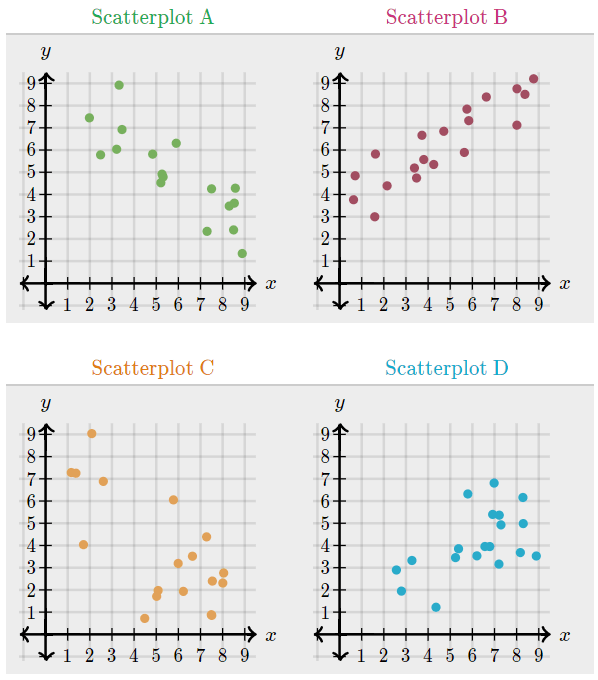
Scatterplot A is negative
Scatterplot B is positive
Scatterplot C is negative
Scatterplot D is positive
300
Simplify: (4x+8)(3x-7)
What is 12x^2-4x-56
300
Evaluate the following according to the graph of f(x) and g(x)
5*f(1)+5*g(9)
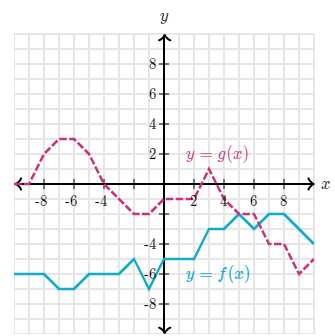
First we can use the graph to find the values of f(1) and g(9). Looking in the fourth quadrant, we can see that f(1) = -5, and g(9) = -6
Now we put those into our equation so
5*(-5)+5*(-6)=-55
300
Is (0, 0) a solution for this inequality?
-38d-57>=-19d+76
What is NO
300
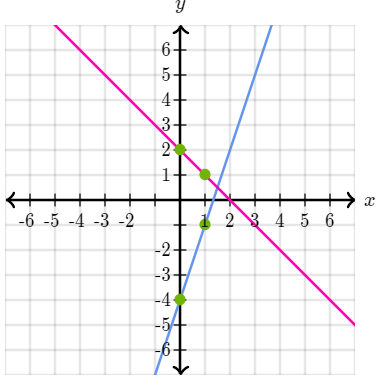
Find the system of equations and its solution for the given graph below
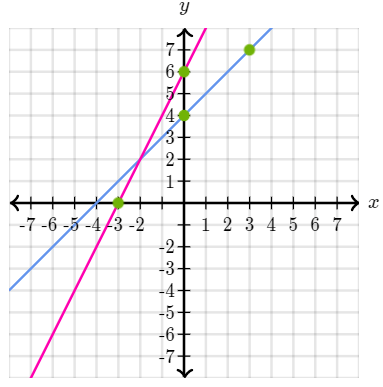
Looking at the graph we can use those two points per line to find the slope and the equation for each line.
y=2x+6,y=x+6
From there, it is easy to see the solution on the graph as it is the point where the lines intersect. The solution is:
x=-2,y=2
300
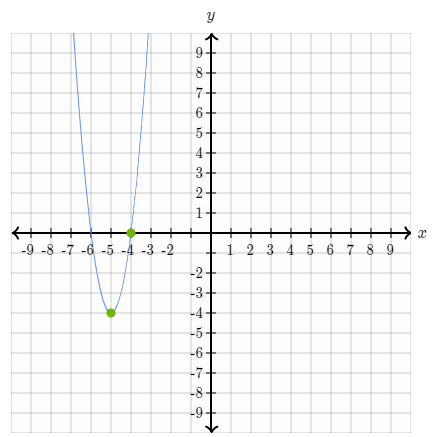
Graph the quadratic equation below and identify any x intercepts
y=4(x+6)(x+4)
Looking at this quadratic equation, we know from a=4 that our parabola is opening up and has a minimum of -4. From there, we find the zeroes of our equation to get our x intercepts:
(-6,0),(-4,0)
400
Match the following correlation coefficients to their graph:
1) -0.71 2) -0.92 3) 0.85 4) 0.39
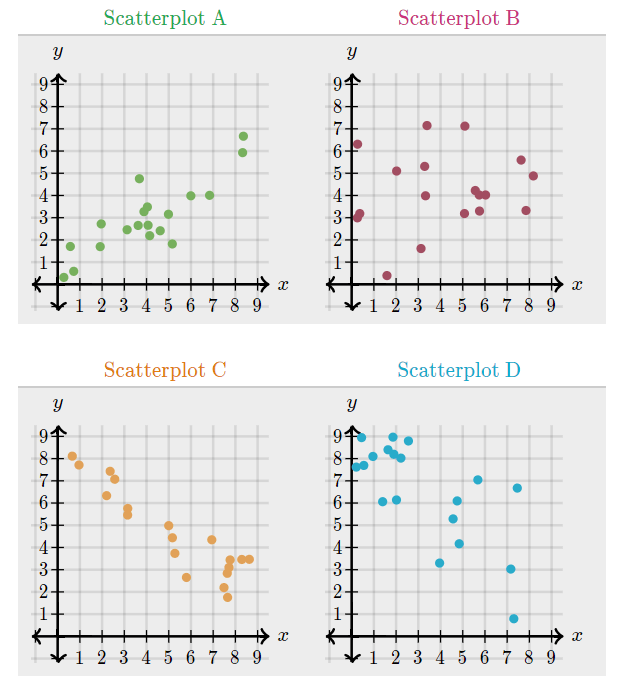
Scatterplot A has a correlation coefficient of: 0.85
Scatterplot B has a correlation coefficient of: 0.39
Scatterplot C has a correlation coefficient of: -0.92
Scatterplot D has a correlation coefficient of: -0.71
400
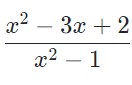
Which answer below is the simplified version of the given expression? AKA which one is equivalent?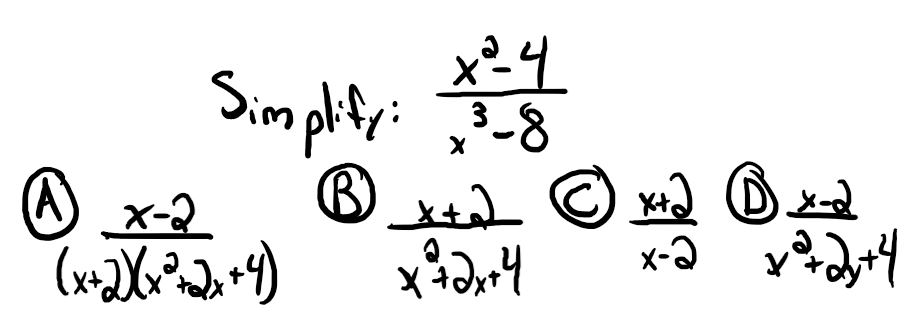
The correct answer is B,
(x+2)/(x^2+2x+4)
To get this answer, we first factor the top and bottom. The top equation becomes
(x^2-4) ->(x+2)*(x-2)
and the bottom becomes
(x^3-8)-> (x-2)*(x^2+2x+4)
400
What is the domain and range of the following graph? Put your answer in inequality notation.
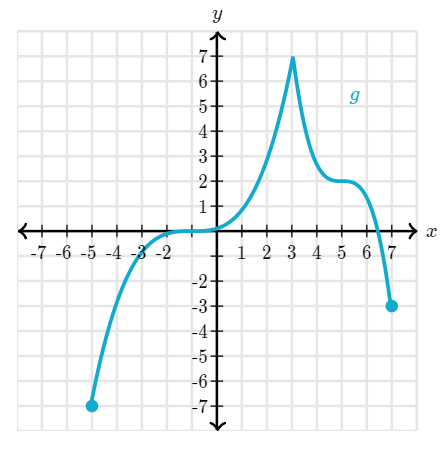
If we look at our graph, we can determine the domain and range by examining the bounds of our x and then y variables.
for our domain:
-5<=x<=7
for our range:
-7<=y<=7
400
Rosie can complete 36 multiplication problems in 3 minutes. If she can keep up the pace, how many minutes (m) would it take for her to complete 54 problems?
To solve this problem, we can set up a proportion equation. We can use the info that she does 36 problems in 3 minutes.
(36/3)=(54/x)
We can use cross multiplication to find
(36x)=54*3
And then we finally solve it for x and get
x=4.5
So Rosie can complete 54 problems in 4.5 minutes!
400
Solve the following system of equations for x and y using elimination
-2x+15y=-24
2x+9y=24
Since we are solving this system using elimination, we are going to start but adding the two equations together
(-2x+2x)+(15y+9y)=(-24+24)
As we do that, enough terms cancel out to find y.
24y=0-> y=0
Since we now know what y is, we can plug it in to find x
-2x+15(0)=-24->-2x=-24->x=12
So the solution is x=12 and y=0
400
Does function A or function B fit the graph better?
Use that function to also predict the plant height in cm at 6 weeks after planting
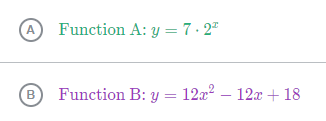
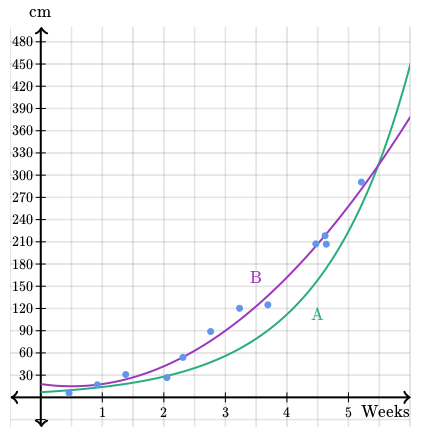
Function B is a better fit for this graph.
Knowing that, we substitute 6 weeks for x to get
y=12*(6)^2-12*(6)+18=378cm
500
Find the slope intercept form of the linear equation of the graph below:
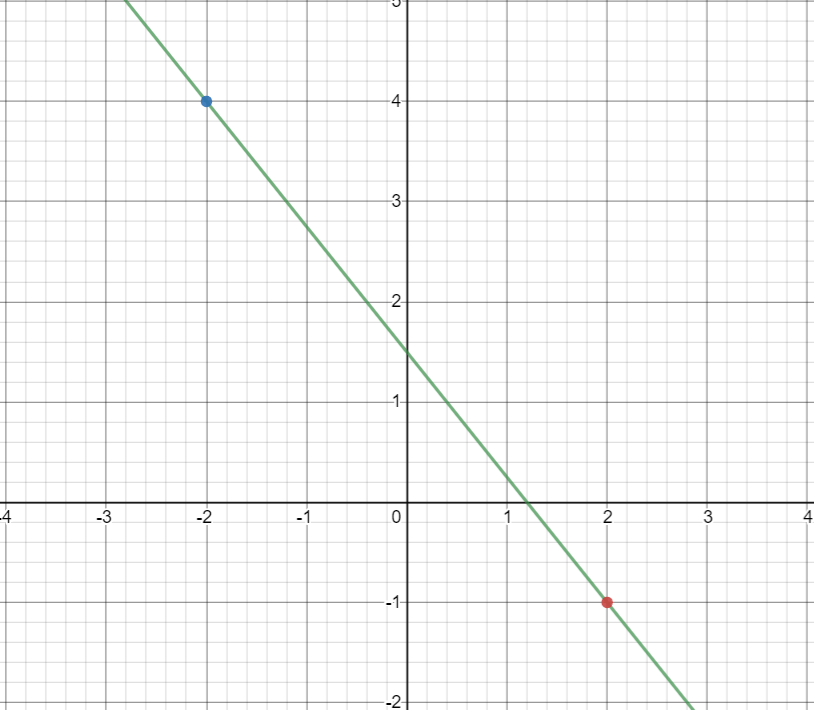
If we examine the graph we find that our two points are (-2,4) and (2,-1), which we can use to find the slope.
(y_2-y_1)/(x_2-x_1)=(-1-4)/(2--2)=(-5/4)
If we examine the graph again, we can see our y intercept is (0,1.5) which means our equation is:
y=(-5/4)x+1.5
500
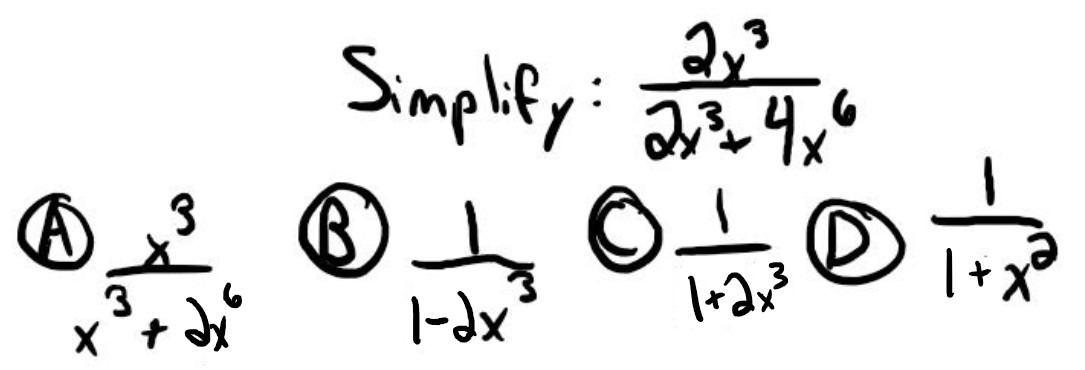
The correct answer is C,
To simplify this equation, we should factor out a common term. All the numbers are multiples of 2 and have a x^3 term, so we'll factor that out.
2x^3*((1)/(1+2x^3))
500
Over which interval is slope 0? 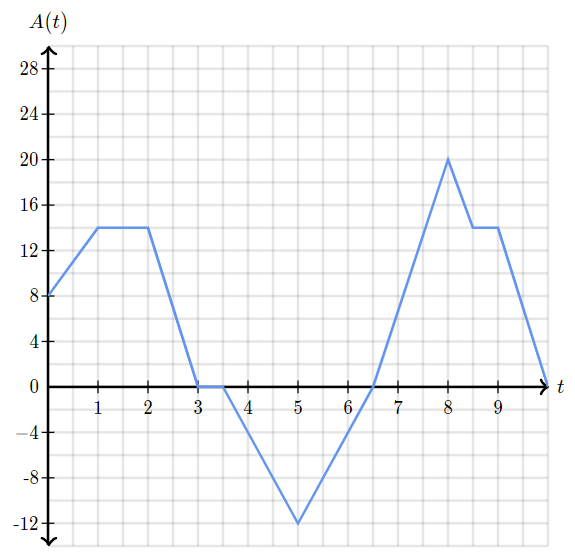
Statements:
A) Between the 6.5 and 10 minute marks, Rosie was above the ground
B) Between the 5 and 8 minute marks, the elevator was traveling upwards
C) Rosie's lowest altitude was 12 meters below the ground
[1, 2] and [3, 3.5]
500
Solve the following linear equation for y
4y-4=5y-8
To solve this linear equation, first we can move all our terms with y to the left and the rest to the right
4y-5y=-8+4
Next we combine like terms on both sides
-y=-4
Finally, we move the -1 over to the other side to get
y=4
500
Solve the following system of equations using substitution
6x-5y=15
x=y+3
To solve this system, since we have an equation for x we will substitute it into the first equation and simplify to find y
6(y+3)-5y=15->6y-5y+18=15->y=-3
From there, we can plug our y value back into the second equation to find the value of x
x=(-3)+3
So our final answer is:
x=0,y=-3
500
Solve the following quadratic for x by taking the square root
(x+5)^2-64=0
To find the solutions, we start to solve for x like normal
(x+5)^2=64->x+5=sqrt(64)
From there we recognize that in algebra we can't assume a square root gives a negative or a positive so we must represent both. So we split those up and solve for both
x+5=+8-> x=3
x+5=-8->x=-13
600
Describe what a line of best fit is and how to find it...
A line of best fit is a line that goes through the center of a scatter plot. You use the squiggle equation to find it! You MUST have x1 and y1 at the top of your table!
600
What is the x-intercept?
(2, 0)
600
A truck driver, Thomas, is driving across the country to deliver school supplies.
The graph below represents the fuel remaining in his gas tank (in liters) as a function of distance driven (in kilometers). According to the graph, how fast did his truck consume the fuel in its tank?
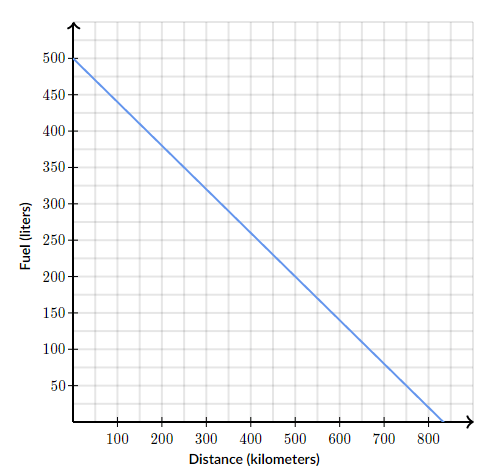
To find the rate of fuel consumption, we can pick two points on the graph and find the slope between them. Let's look at the points (0 km, 500 L) and (250 km, 350 L).
Using these two points, we can put them in the equation for slope to find the fuel consumption rate.
(y_2-y_1)/(x_2-x_1)=(350-500)/(250-0)=-(3/5)
So the truck consumes (-3/5) L per km
600
Solve the following linear inequality for x (use fractions reduced to the lowest terms)
54x+64>=49x+59
To solve this inequality, first we can move our x terms to the left side and all others to the right
54x-49x>=59-64
Next we combine like terms
5x>=-5
And finally, we move the 6 to the other side which gives us
x>=-1
600
Graph the following system of equations and use it to find the solution (use fractions if needed)
y=-x+2
y=3x-4
The graph should look like this:
So then we can see the answer will be
x=3/2,y=1/2
600
Use the quadratic equation to solve the following quadratic for x
10x^2=6+9x
First, let's rearrange it so it looks like standard form
10x^2-9x-6=0
Now we just have to plug those values into the quadratic formula
x=(9+-sqrt((-9)^2-4(10)(-6)))/(2(10))
And finally we simplify to get
x=(9+-sqrt(321))/(20)