Shape of Distributions & Calculations
Comparing Dot Plots
Comparing Box Plots
Comparing Histograms
100
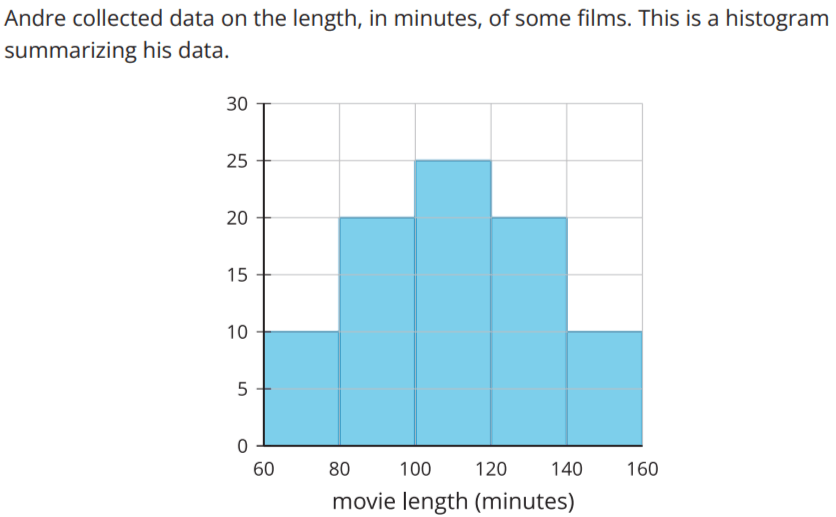
What is the shape of distribution?
Symmetric
100
Determine if each statement is true or false.
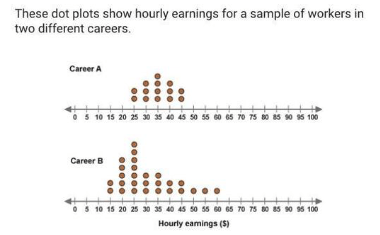
1. The median hourly earning is greater for Career B than it is for Career A.
2. The mean hourly earning is greater for Career A than it is for Career B.
1. False (A:35 and B:25)
2. True (A:35 and B:31)
100
*
Which of the statements must be true about the distribution of data represented in the boxplots?

A. The people in Group B typically spent more time shopping than people in Group A.
B. The middle half of the data for Group A has more variability than the middle half of the data for Group B.
C. The total minutes spent shopping for Group A is greater than the total minutes spent shopping for Group B.
D. The median minutes spent shopping for Group B is less than the median for Group A.
D
100
The following histograms show the mileage a car gets in the city and on the highway. Where does the car get better gas mileage, the city or highway?
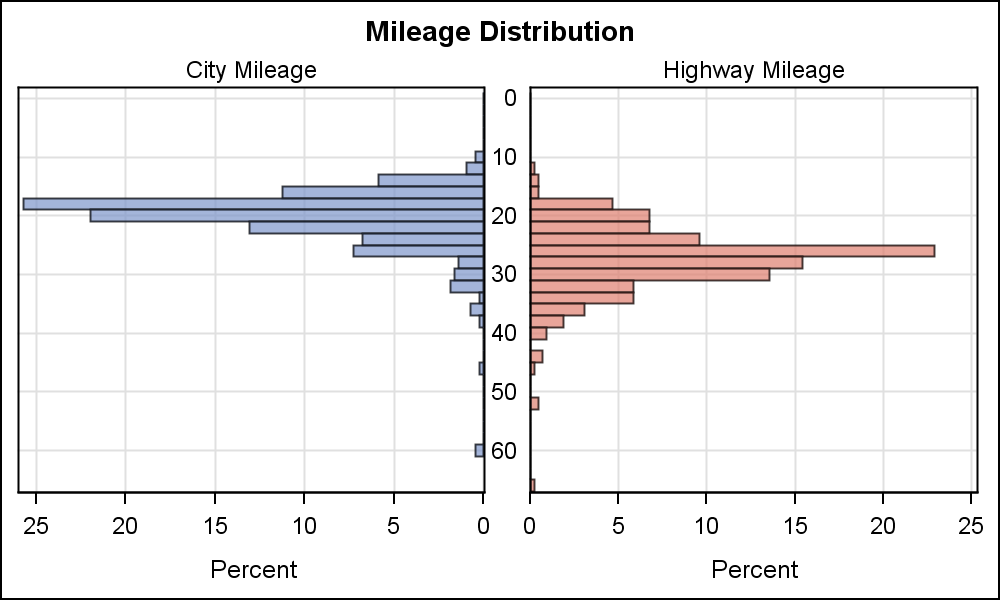
Describe the shape of each graph.
Highway
200
What is the shape of distribution?
Skewed right
200
Determine if each statement is true or false.
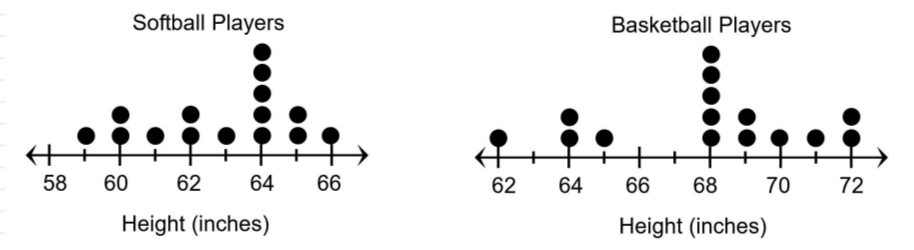
1. The range of the data for the heights of softball players is less than the range of the data for the heights of basketball players.
2. The median of the data for the heights of softball players is greater than the median of the data for the heights of basketball players.
1. True
2. False
200
Compare the shapes, the centers, and the spreads of the box plots.
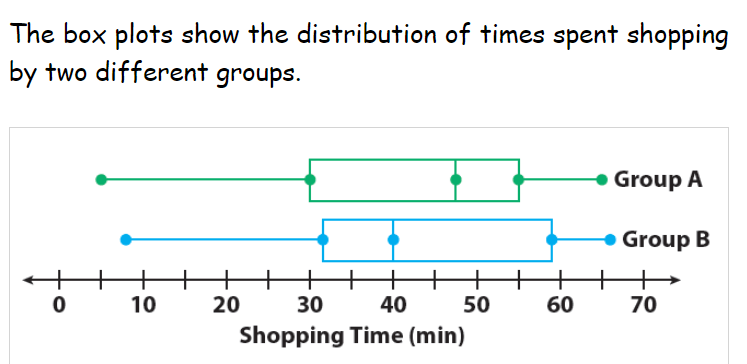
They are both skewed left, the median of Group A is greater that the median of Group B, they have a similar spread (Group A is slightly more spread out).
200
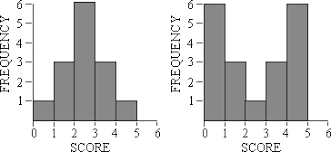
Describe the shape of each graph.
Graph A is symmetric and bell-shaped. Graph B is symmetric and bimodal.
300
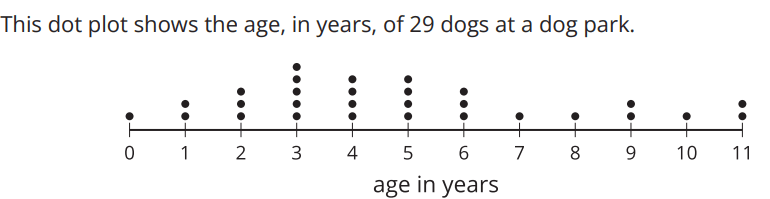
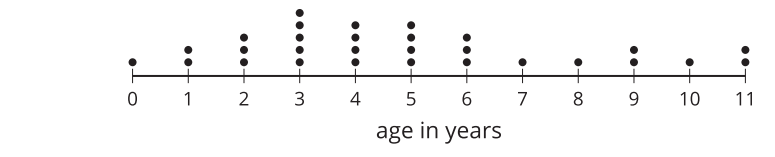
What is the median age of dogs at the park?
4 years old
300
*
The low temperature in degrees Celsius for 2 cities on the same days in March are recorded in the dot plots. Select ALL the true statements.
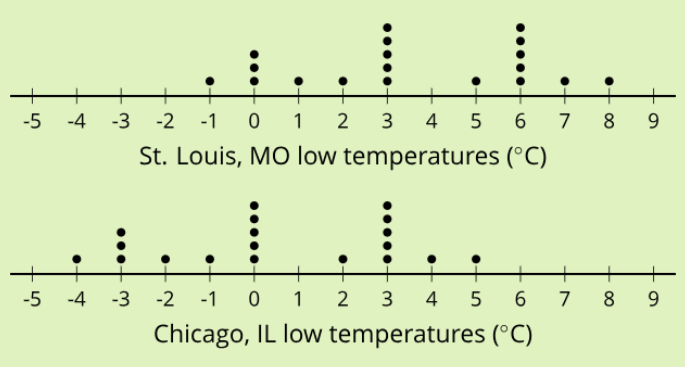
A. In St. Louis, it is warmer every day than it is in Chicago.
B. Chicago's temperatures have more variability than St. Louis' temperatures.
C. The standard deviation of Chicago's temperatures is the same as the standard deviation of St. Louis' temperatures.
D. For both cities, the mean temperature is equal to the median temperature.
E. The mean temperature of St. Louis is warmer than the mean temperature of Chicago.
C and E
300
*
Which of the statements must be true about the distribution of data represented in the boxplots?

A. The median number of sales for Store A is greater than the median number of sales for Store B.
B. Store A sold more wristbands than Store B.
C. Store A had more variable sales than Store B.
D. The middle half of the data for Store B has more variability than the middle half of the data for Store A.
C
300
*
Which graph has a greater standard deviation?

B
400
What is the mean age of dogs at the park?
4.9 or 5 years old
400
*
Ms. Lohman surveyed the students in her math classes to find out how many minutes each one studied for the last test. Which of the following statements are supported by the data in the two dot plots? Select ALL of the true statements.
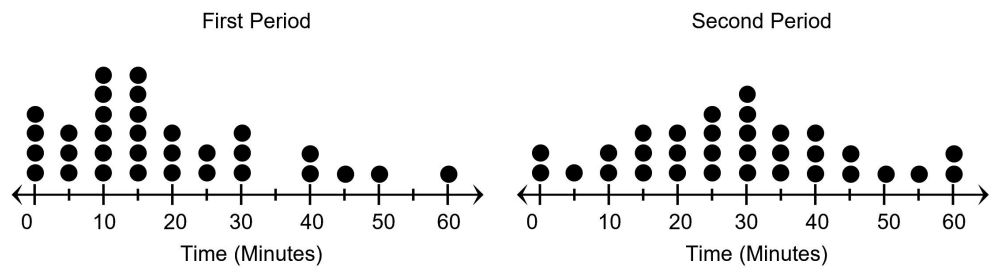
A. The data for 2nd period is more symmetrical than the data for 1st period.
B. The range of the data for 1st period is less than the range of the data for 2nd period.
C. The median number of the data for 2nd period is greater than the median number of the data for 1st period.
D. The data for 1st period is skewed more to the right than the data for 2nd period.
E. For both periods, the mean is equal to the median.
A, C, and D
400
Compare the shapes, the centers, and the spreads of the box plots.
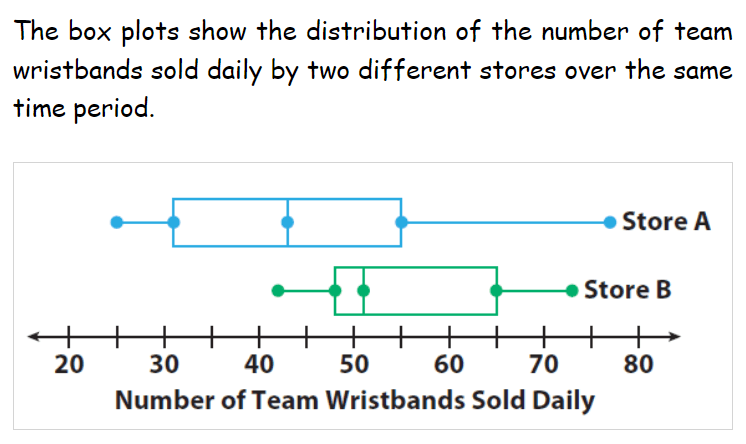
They are both skewed right, the median of Store A is less than the median of Store B, Store A has a wider spread than Store B (Store B had a greater number of sales overall).
400
*
Is there an outlier on this graph? How can you calculate if a data value is an outlier?

Yes there is (visually). You can calculate an upper bound outlier using this equation: Q3 + (1.5*IQR).
500
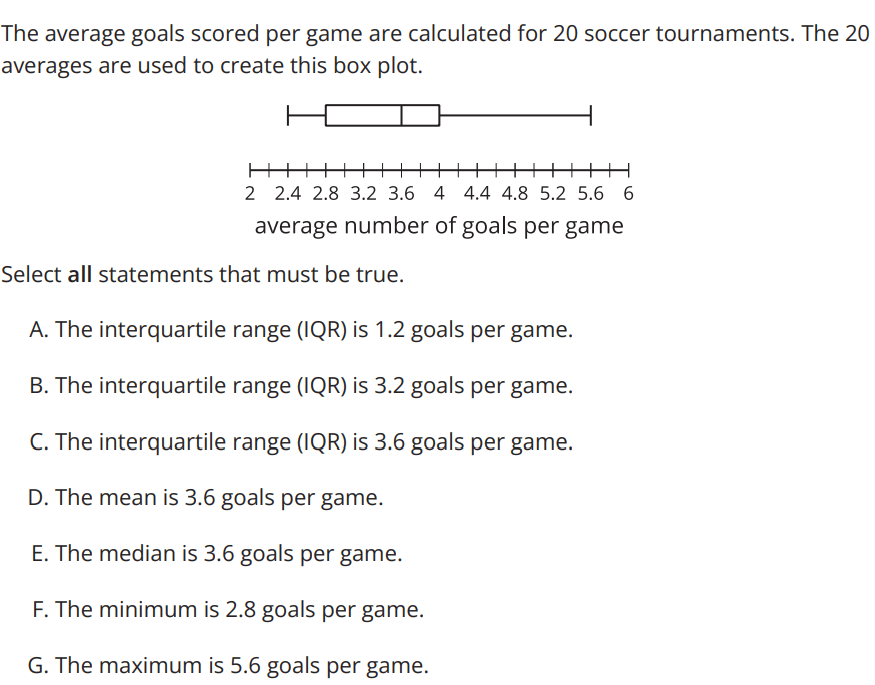
A, E, and G
500
*

Select ALL of the true statements.
A. The mean and median values of hourly earnings shown in the dot plot for Career B are the same.
B. The median value of hourly earning for Career A will remain unchanged after a company head is hired to have an hourly earning of 100 dollars.
C. The standard deviation of hourly earnings shown in the dot plot for Career B is greater than the standard deviation of hourly earnings for Career A.
D. The median values of hourly earnings shown in the dot plots for the two careers are the same.
E. The new company head with an hourly earning of 100 dollars will affect the mean value for hourly earnings for Career B more than the median value for hourly earnings for Career B.
B, C, and E
500
For each graph, what percentage of students are 68 inches or taller?
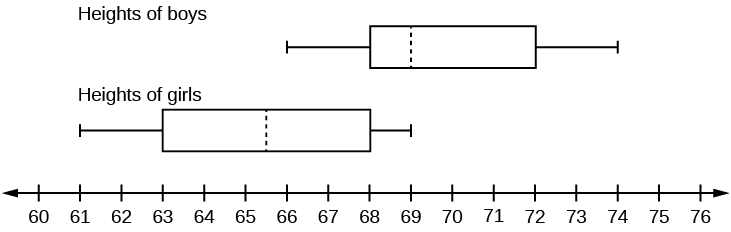
boys: 75%
girls: 25%
500
*
Use the shape of the distribution to compare the mean and median. Are the mean and median equal? If not, which is greater?
The mean, the distribution is skewed to the right, so the values greater than the typical values will pull the mean up to a higher value and not affect the median as much.