Plots
Bivariate Data
Correlation
Standard Deviation
Final Jeopardy
100
This term refers to
a graph in which the values of two variables are plotted along two axes, the pattern of the resulting points revealing any correlation present.
Scatter Plot
100
150
100
Does correlation imply causation?
No, correlation does not imply causation.
100
How do we find a deviation (not the standard deviation) from the mean?
Number - mean = deviation
100
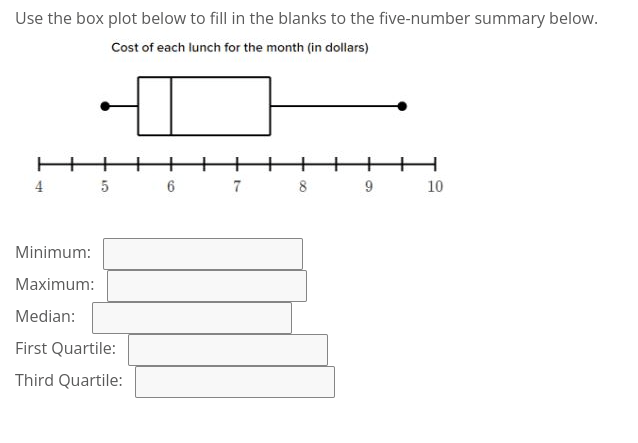
Minimum: 5
Maximum: 9.5
Median: 6
1st Quartile: 5.5
3rd Quartile 7.5
200
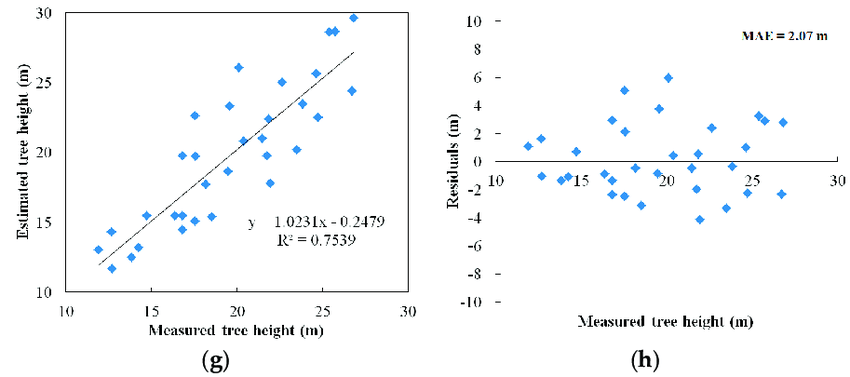
This graph displays the residual values on the y-axis and fitted values, or another variable, on the x-axis. After you fit a regression model, you can use this to see how linear the relationship truly is.
Residual plot
200
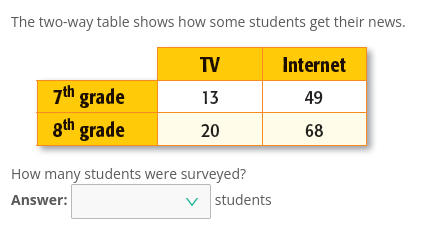
What percent of girls chose B?
12.5%
200
The correlation coefficient will be between...
-1 and 1
200
Why do we square the deviations to find a standard deviation?
If we added up the deviations, they would equal 0.
200
Find the regression line (least squared line) of this set of data.
x: 12, 14, 17, 19, 21, 30, 35
y: 300, 250, 360, 390, 741, 500, 600
y=13.54x+ 162.36
300
What can we learn from a scatter plot?
(3 answers, you only need one)
direction (upward, downward), strength, and form (linear, exponential, quadratic)
300
What percent of participants were girls?
40%
300
How can we find the correlation coefficient?
Using a calculator designed for that purpose.
300
If there are 7 numbers in a set, what would we divide the sum of the squares of the deviations by?
6
(7-1)
300
If a computer stat output would give this regression line equation: y(hat) = 19.5 + .563x, with the highest residual being 3 and the lowest being -2, what would be the expected range for value when x = 12.
24.26 - 29.26
26.26 is the expected result. Subtract the lowest residual to get the low end of the range. Add the highest residual to get the high end.
400
How do you measure a residual?
Observed value - Expected Value = Residual
400
How many students were boys who chose D?
20
400
Find the correlation coefficient.
x: 12, 14, 17, 19, 21, 30, 35
y: 300, 250, 360, 390, 741, 500, 600
0.6526
400
What does standard deviation tell us that the mean doesn't?
How far we can expect the actual numbers to be from the mean. A smaller standard deviation means that the numbers are closer to the mean (not spread out).
500
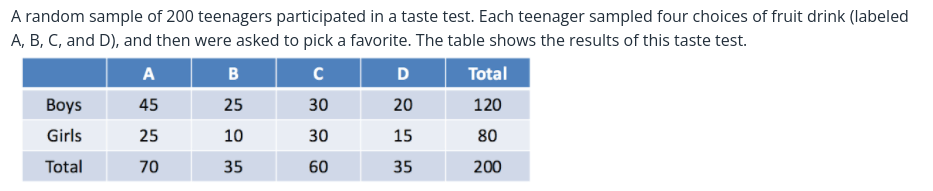
How would you describe this relationship?
Linear, upward, strong.
500
What percent of students were girls who chose drink A?

12.5%
500
How would you describe (positive/negative, strong/weak) a correlation coefficient of 0.98?
Positive, strong
500
Find the standard deviation of this group of numbers
50, 69, 70, 75, 75, 90, 85, 80, 70, 60, 100, 95, 90, 80, 85, 50
14.7