Functions & Relations
Domain, Range & Evaluating Functions
Intercepts & Zeros
Graphs & Their Characteristics
Calculator & Regents Challenge
100
Does {(-6, 4), (-1, 4), (3, 9), (8, 12)} represent a function? Explain.
Answer: Yes because very input (x) has exactly one output (y)
100
Find the domain and range of
{(-7, 2), (0, 5), (4, 2), (9, -3)}.
Answer:
Domain (x): {-7, 0, 4, 9}.
Range (y): {-3, 2, 5}.
List each output only once.
100
A line crosses the axes at (-8, 0) and (0, 6). State its x-intercept, y-intercept, and zero.
Answer:
x-intercept: (-8, 0)
y-intercept: (0, 6)
zero: x = -8. A zero is an input whose output is 0.
100
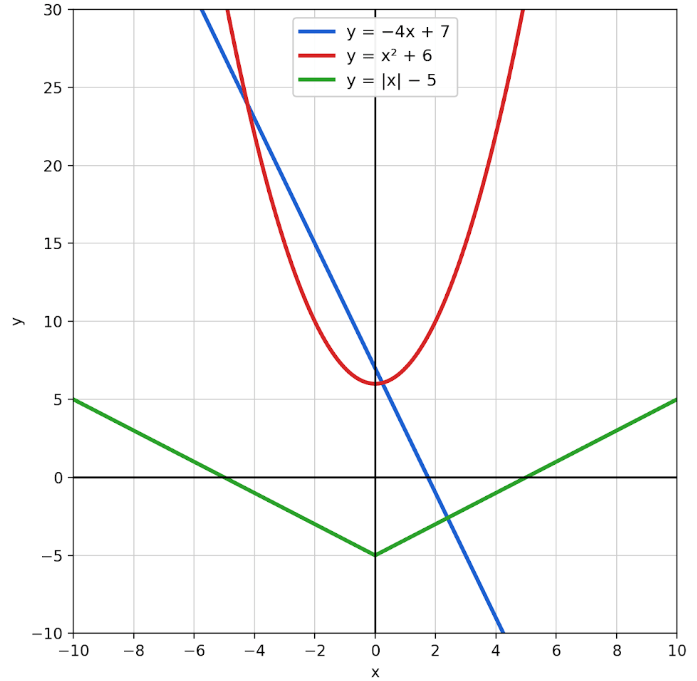
Match each function to its graph shape:
U shape, V shape, straight line
y = -4x + 7
y = x² + 6
y = |x| - 5
Answer:
y = -4x + 7: straight line;
y = x² + 6: upward-opening parabola (U shape);
y = |x| - 5: V shape.
100
Use your TI-Nspire CX II to evaluate
f(x) = 7 - 3x at x = -6.
Answer: 25
f(-6) = 7 - 3(-6) = 25.
Enter 7 - 3×(-6) on a Calculator page.
200
Does this table represent a function? Explain.
| x | y |
|---|---|
| -5 | 1 |
| -2 | 7 |
| -2 | -4 |
| 6 | 10 |
Answer: No. The input, x= -2 has two different outputs, y= 7 and -4.
200
For f(x) = -4x + 9, find f(-3).
Answer: 21
f(x) - -4x + 9
f(-3)= -4(-3) + 9
12 + 9
21
200
For g(x) = 5x - 35, state both intercepts as ordered pairs.
Answer: x-intercept: (7, 0); y-intercept: (0, -35).
g(0) = 5(0) -35 = -35 y-intercept: (0, -35)
0 = 5x -35
35 = 5x
7 = x x-intercept: (7, 0)
200
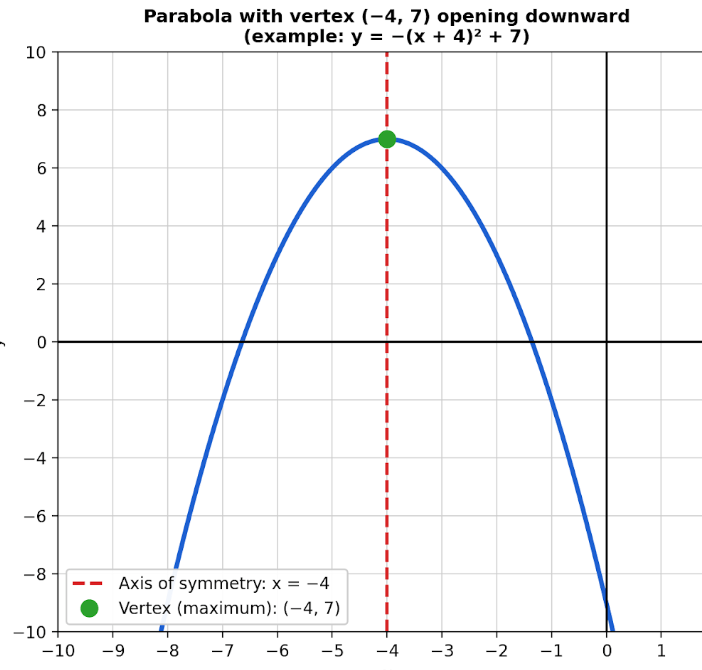
A parabola has vertex (-4, 7) and opens downward. State its axis of symmetry and whether its vertex is a maximum or minimum.
Answer:
Axis of symmetry: x = -4.
The vertex (-4, 7) is a relative and absolute maximum.
200
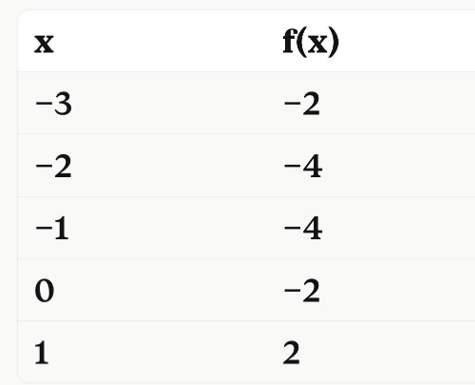
Create a table for f(x) = x² + 3x - 2 using x = -3, -2, -1, 0, 1.
Answer:
300
Does the map below represent a function? Explain
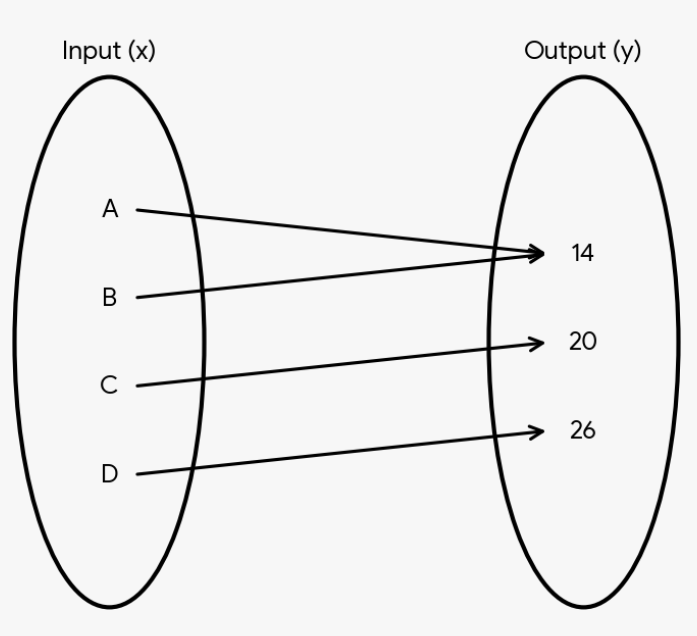
Answer:
A. Yes. Every input, x, has exactly one output, y.
300
For f(x) = x² + 2x - 3 with domain {-4, -1, 2}, find the range.
Answer: Range: {-4, 5}.
f(-4) = (-4)2 + 2(-4) - 3 = 5
f(-1) = (-1)2 + 2(-1) - 3 = -4
f(2) = (2)2 + 2(2) - 3 = 5.
Only list once.
300
Use your TI-Nspire CX II graph to find the zeros of p(x) = x² + 3x - 28.
A. -4, 7 B. -7, 4
C. -3, 28 D. 3, -28
Answer: B. -7 and 4.
The graph crosses the x-axis at (-7, 0) and (4, 0).
On a Graphs page use Menu → Analyze Graph → Zero near each crossing.
300
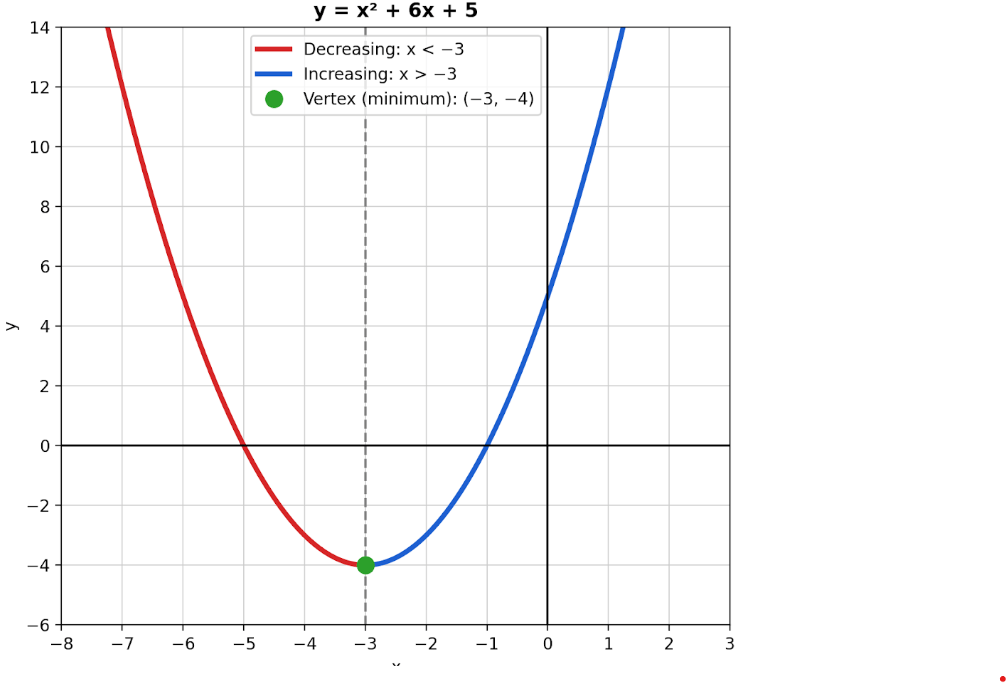
Graph y = x² + 6x + 5 on your calculator. State the vertex and where the function is decreasing and increasing.
Answer: Vertex: (-3, -4), a minimum. Decreasing for x < -3; increasing for x > -3.
300
Graph y = -2x + 6. Sketch it using both intercepts, and state where the function is positive.
Answer:
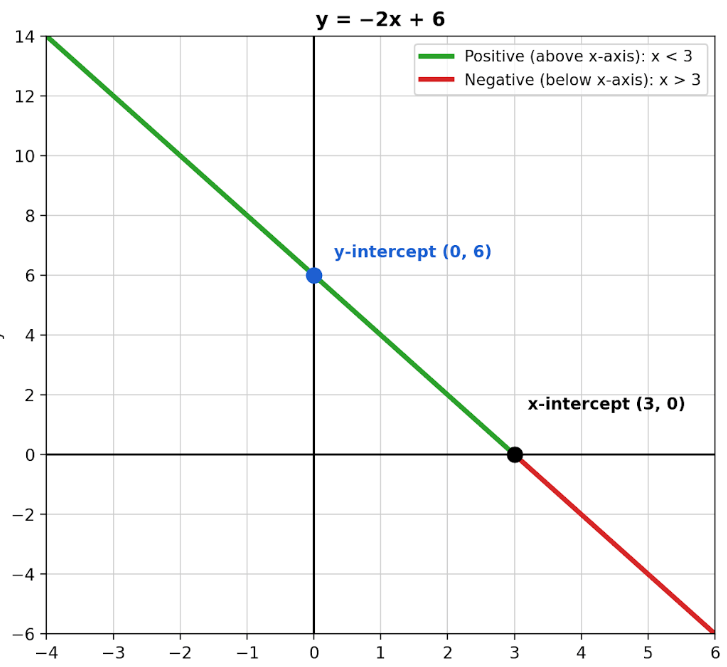
The function is positive for x < 3.
400
Does this graph represent y as a function of x?
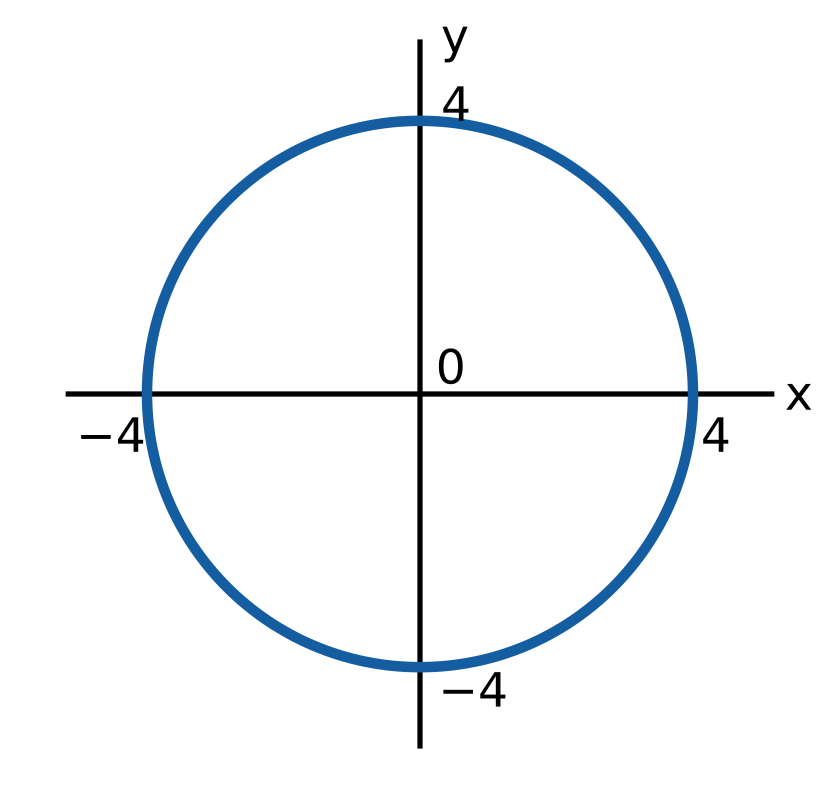
Answer: The graph is not a function because it fails the vertical line test.
If a vertical line was drawn through the graph, there is at least one place where the line would go through the graph more than once.
400
Ribbon costs $2.80 per meter; any length from 0 to 9 meters can be bought. If graphed would discrete or continuous? Explain
Answer: Ribbon: continuous, because fractional lengths can be bought.
400
A candle is 30 cm tall and burns at 1.5 cm per hour. Write h(t), then state and interpret its y-intercept.
Answer: h(t) = 30 - 1.5t The y-intercept is (0, 30): the candle is 30 cm tall before burning begins.
400
Where is this graph decreasing? State the relative maximum and minimum values.
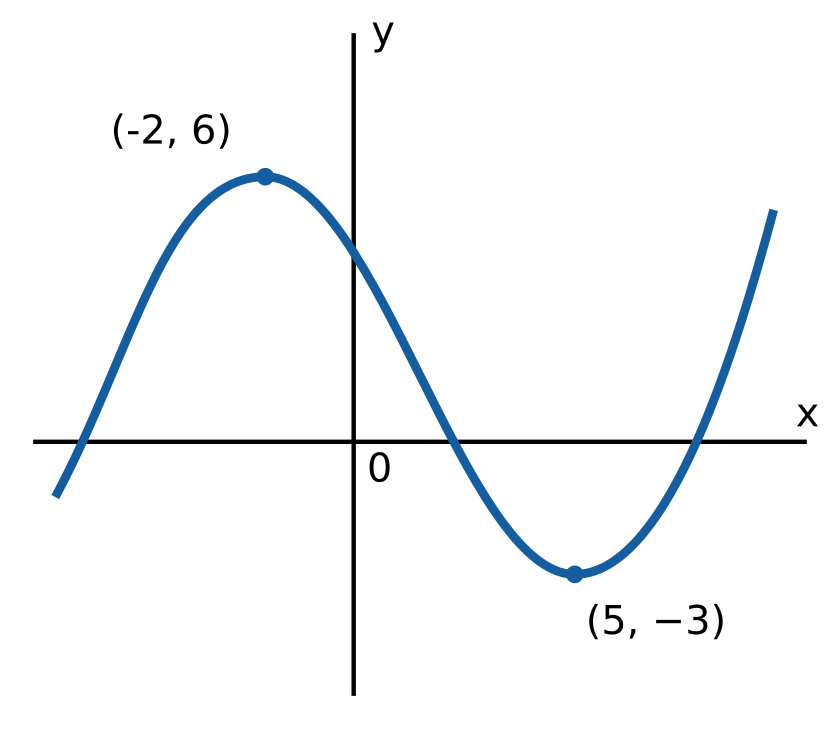
Answer:
Decreasing for -2 < x < 5.
Relative maximum value: ( -2,6)
Relative minimum value: (5,-3)
400
Use your calculator to evaluate
f(x) = (3/4)x² - ((1/2)x + 5) at x = -4.
Answer: 9
f(-4) = (3/4)(-4)² - ((1/2)(-4) + 5)
12 - (-2 + 5) = 9
500
Which representations are functions?
I: {(-8, 3), (-8, 9), (2, 11)}.
II: y = x² - 8.
III: mapping -6 → 5, 0 → 5, 7 → 12.
IV: the vertical line x = 9.
A. I and II B. II and III C. III and IV D. II only
Answer: B. II and III.
II assigns one y to each x.
III gives every input one output.
500
If f(x) = x² - 7 and g(x) = 3x + 5, at which input is f(x) < g(x)?
A. -4 B. -3
C. 3 D. 6
Answer: C.
f(3) = (3)2 - 7 = 9 -7 = 2
g(3) = 3(3) + 5 = 9 + 5 = 14
2 < 4
500
A model rocket has height h(t) = -5t² + 20t + 25 meters. Use a graph to find when it reaches the ground and interpret the relevant intercept.
Answer: At t = 5 seconds. The relevant intercept is (5, 0): after 5 seconds the rocket is at ground level.
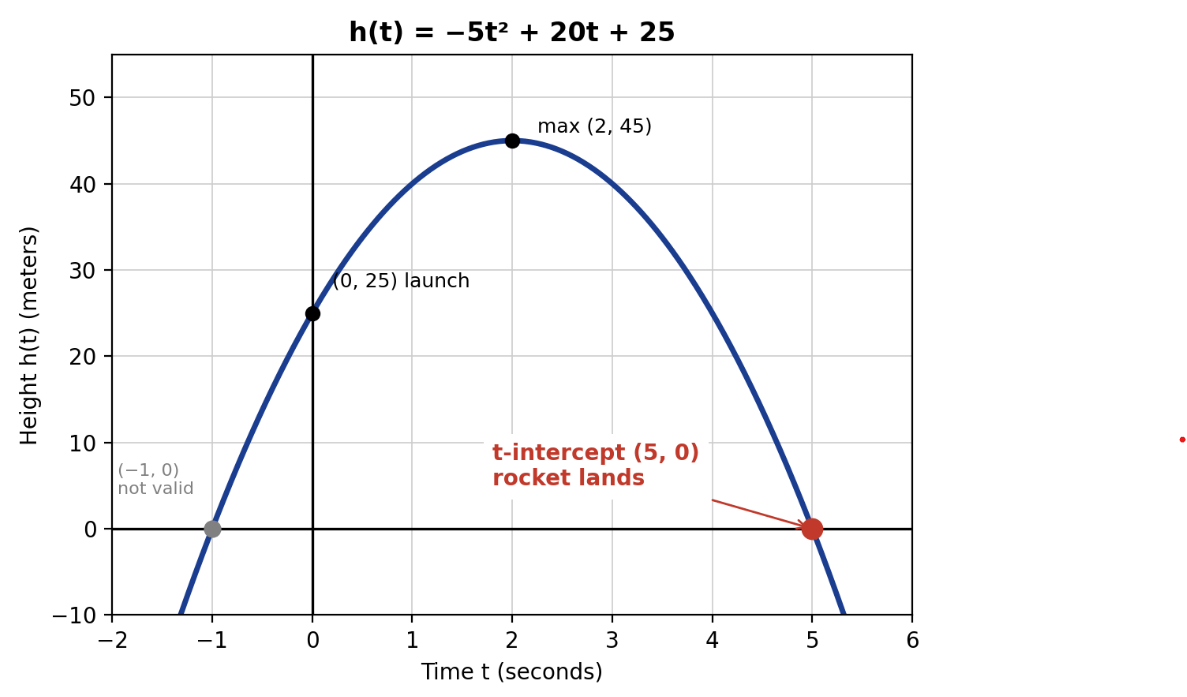
The other zero is -1, which is outside the physical domain t ≥ 0.
500
Graph q(x) = -x² - 2x + 8. State its relative maximum, where it is increasing, and how y changes as x moves far to the right.
Answer:
Relative maximum at (-1, 9).
Increasing for x < -1.
As x increases far to the right, y decreases.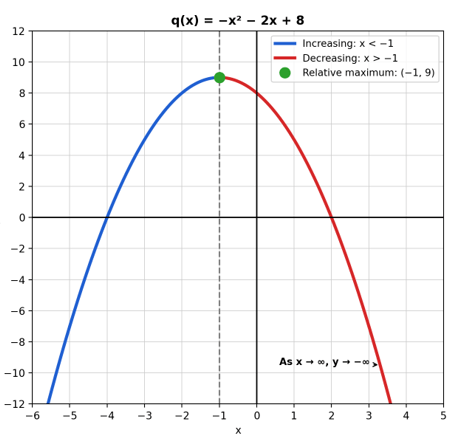
500
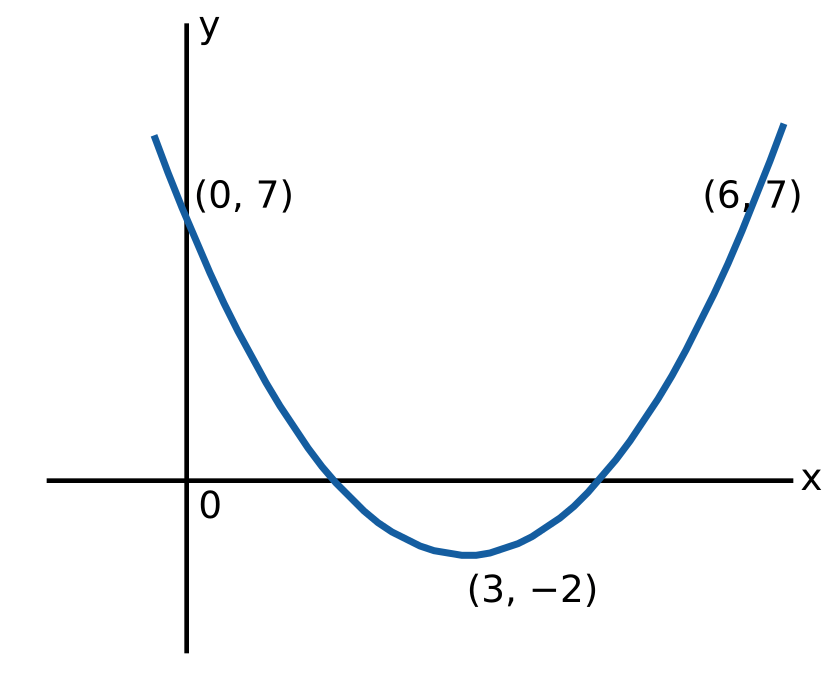
Use your TI-Nspire CX II to graph t
f(x) = x² - 6x + 7.
Sketch the graph and state its minimum, decreasing interval, and zeros to the nearest hundredth.
Answer: minimum (3, -2), y-intercept (0, 7), and symmetric point (6, 7). Decreasing for x < 3. Zeros: x ≈ 1.59 and 4.41.
Use Analyze Graph → Minimum and Zero; sketch a smooth curve through these features.