What does Q1 stand for?
First Quartile, Quartile 1, or Lower Quartile
What does this symbol represent: σ
Standard Deviation
What do you press if need to start completely fresh?
Home/On button, and then 1 for a New Document. DO NOT SAVE DOCUMENT
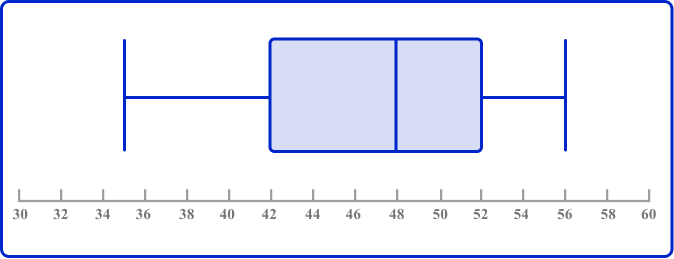
What is the median of the following Box Plot:

48
What does a symmetric distribution look like?
The right side is a mirror image of the left
What does IQR stand for?
Interquartile Range
Here are the weights, in pounds, of 8 babies
6, 5, 12, 7, 8, 5, 9, 8
Find the mean weight
7.5 lbs
Using your calculator, find the five number summary of:
1, 17, 8, 95, 43, 100, 12, 0, 13, 2
Min Q1 Median Q3 Max
0 2 12.5 43 100
What percent of values fall above the median for any data set?
50%
What type of plot shows every data point?
Dot Plot
Define Median
The value in the middle of a data set
Here are the weights, in pounds, of 8 babies
6, 5, 12, 7, 9, 5, 9, 9
Find the median weight
8
Find 22% of 37
8.14
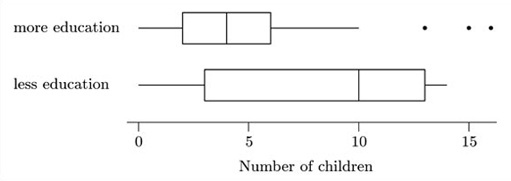
Which box plot has a smaller interquartile range?

Top- More education
What is the range of the following box plot?

10
Define mean
The average of a data set
Data Set A has a standard deviation of 1, and Data Set B has a standard deviation of 20. Which data set clusters closer to the mean. Why?
Data Set A - smaller standard deviation
Use your calculator to find the mean of the following data set:
5, 5, 5, 6, 6, 9
Show me the answer on the calculator
6
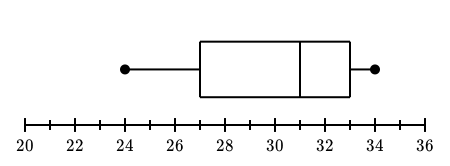
Here is the box plot that represents the amount of students per classroom at ITC. What percent of classrooms have more than 27 students?

75%
How many students have a shoe size of exactly 7?

Impossible to tell!
Define standard deviation
Where does the middle 50% of data always fall?
In between Q1 and Q3
In the IQR
In the box of the box plot
Find the standard deviation of the following data set:
1, 2, 100
Explain why the standard deviation is so high/low
46.435
It is so high because the data points are very spread out
Here are the weights of 1736 High School students:

How many students weight more than 175 lbs?
434

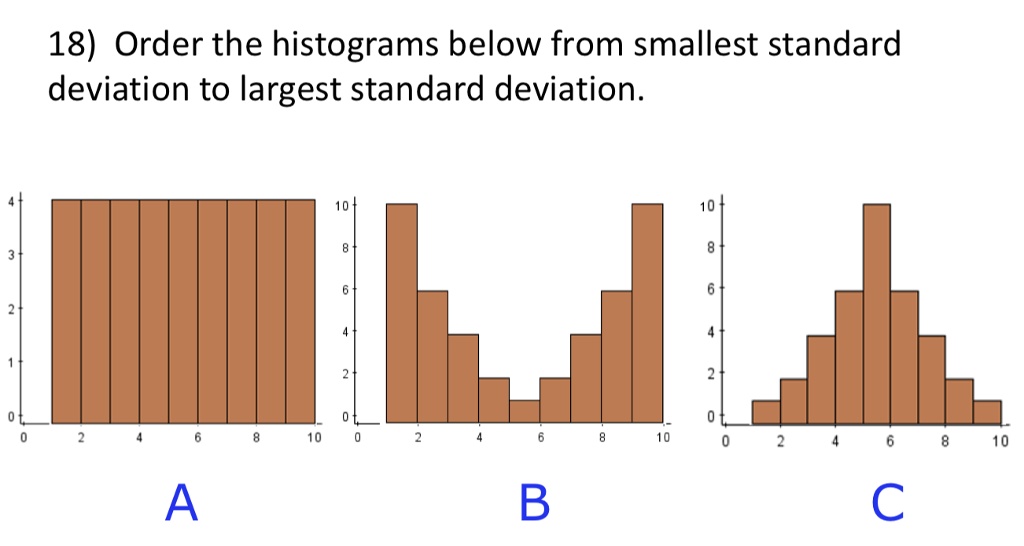
C, A, B