Map Projections
Population pyramids
Industrial revolution
Economic Activities
100
This is the map projection we see most commonly.
Mercator
100
a population pyramid with a large base and a very thin top shows us what about the area?
low economic development
100
energy resources, minerals or agricultural products, and transportation routs are the main factors of____
deciding where to put a factory
100
A grocery store is an example of a
Non Basic Economic Activity
200
on this map projection, the sizes of land masses are the most accurate
Peters
200
what can we assume about the region based on the population pyramid
high guest worker population
200
Where a lumber mill should be located
closer to the resource
200
large shopping districts are an example of
agglomeration and the gravity model
300
This map projection has longitude lines converge at only 1 pole
Conic
300
the region shown has had what major event happen within their population?
Baby Boom
300
Where a car factory should be located
closer to the market
300
Actions that generate new money are considered
Basic economic activities
400
This map projection doesn't extend to the polar regions of the earth
Robinson
400
what can be inferred about the region shown?
economically developed
400
small, home-based businesses are called
cottage industries
400
When the location decision for one factory is dependent upon the location of other related factories
Locational Interdependence
500
Which map projection was made in 1963
Robinson
500
what can be inferred about the region in the population pyramid shown?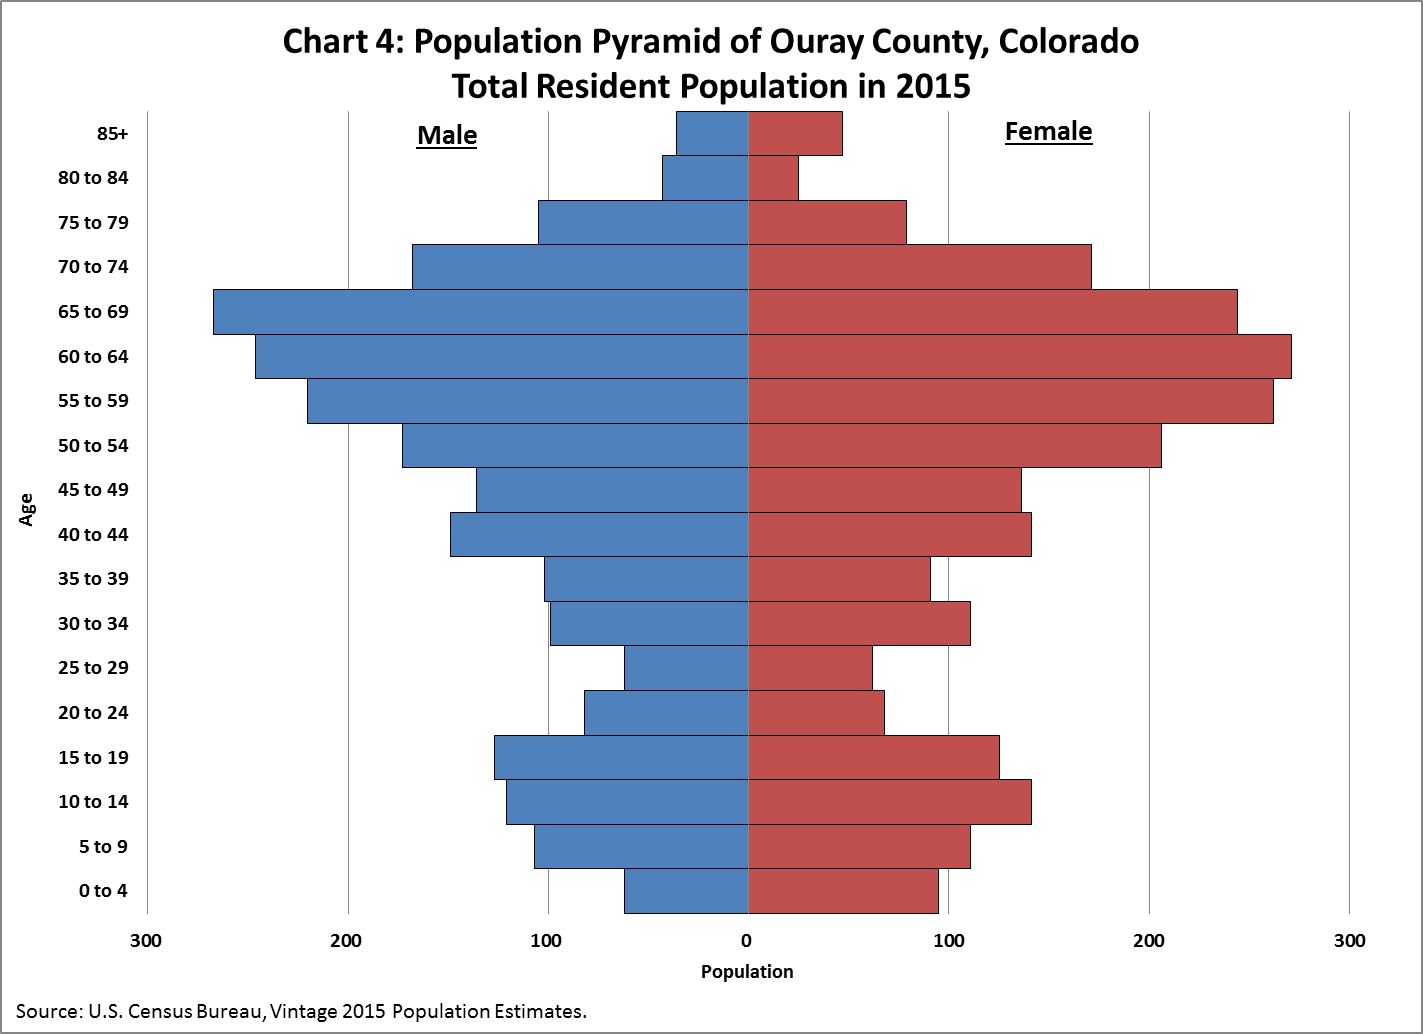
lack of job causes young people to move away; attracts retirees
500
Who developed the least cost theory?
Alfred Weber
500
A hub for information-based industry and high tech manufacturing
technopoles