Quantitative Data Display
Categorical Data Display
Cat. and Quant. Variables
Comparing VSCO
Describing Distribution
100
Name this Graph
What is a histogram?
100
On histograms and bar graphs, what value MUST be shown on the y axis?
What is 0?
100
A variable that is a measurable value, i.e. always a number
What is a quantitative variable?
100
"The average number of shoes owned by boys is less than the average owned by girls"
What is comparing center
100
This graph distribution has two modes/peaks.
What is bimodal?
200
Name this graph
What is a dot plot?
200
Which two charts that we discussed are used for categorical data?
Pie Chart & Bar Graph
200
A variable that assigns an individual to a group, i.e. usually a word answer
What is a categorical variable?
200
Girls have no outliers, while boys have an outlier of 40 pairs of shoes
What is comparing outliers
200
This graph has a tail going to the right.
What is right skewed?
300
What quantitative display of data has the a column showing the shared tens value on one side of a line, and each data point's ones value on the other side of the line?
What is a stem plot?
300
You always need to the x (and if present the y) axis for all graphs
What is LABEL?
300
The subject or item you are collecting data from is called the...
What is an individual?
300
"Both distributions are skewed right, but the girl's has a longer tail"
What is comparing shape?
300
The left and right sides of this graph appear mirrored.
What is symmetric?
400
In a stemplot showing age of gym members, what does the value
5 l 6
likely mean?
What is 56 years old?
400
Why should you never use pictures, images, or 3D bars to represent data on bar graphs?
Using any of these makes the differences look exaggerated (or not proportional)
400
Identify the types of variables within this chart.
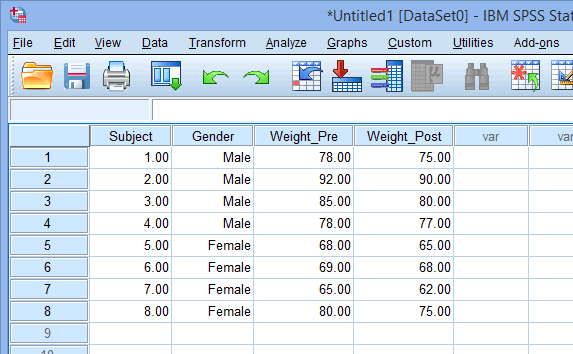
What is one categorical variable and two quantitative variables?
400
"The standard deviation of the girl's shoe pairs is larger than boys, so the girl's data is more spread out."
What is comparing variability
400
In this distribution the mean is greater than the median.
What is right skewed?
500
Creat a split stem (0-4 and 5-9) Stem Plot for the data below:
Total number of Places Lived (by Tolles Teachers):
4 4 5 6 7 7 7 8 8 8 9 10 10 10 11 13 13 14 15 16 18 21
See board
500
When displaying a pie chart, your data should always be exclusive.
What is mutually exclusive (or not overlapping)
500
Identify the variables within this chart as categorical or quantitative.
What is 2 categorical variables and 4 quantitative variables?
500
Both graphs are symmetric, but the girl's data has a wider curve
What is comparing shape and variability
500
Draw a dot plot that is skewed left
See board