Describing Data
Linear Regression
Studies and Experiments
Probability & Distributions
Inference
100
This measure of center is more resistant to outliers than the mean.
What is the median?
100
This measure is calculated by taking observed y - predicted y
What is the residual?
100
This type of sample takes a random sample from within several different subgroups of a population.
What is a stratified sample?
100
This type of probability distribution represents situations in which there are only two possible outcomes.
What is binomial?
100
This type of significance test is used for the mean of a single population when the standard deviation of the population is unknown.
What is a 1-Sample t test?
200
To calculate this, subtract the mean of the distribution from the observed x, then divide by the standard deviation.
What is the z-score (or standardized score)?
200
This quantity measures the direction and strength of a linear relationship between two quantitative variables.
What is r or the correlation coefficient?
200
This is a type of study where treatments are imposed.
What is an experimental study?
200
This is a word used to described two events that cannot simultaneously be true.
What is mutually exclusive?
200
This is the point estimate and margin of error for the 1-proportion z-confidence interval of (0.36, 0.50)
What is 0.43 and 0.07?
300
It's the word the best describes the shape of this histogram.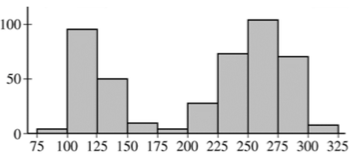
What is bimodal.
300
This is the percent of variation in the values of y that can be attributed to (explained by, accounted for) the LSRL of y on the x variable.
What is r-squared or the coefficient of determination?
300
This experimental design involves the random assignment of units to treatments which are carried out separately within each group of units known to be similar in some way that is expected to affect the responses.
What is block design?
300
The standard deviation of a sampling distribution is inversely proportional to this.
What is square root of n (square root of the sample size)?
300
This is the p-value that would result from a X2 test statistic of 23.4 and df = 4.
What is 0.000105?
400
Given the data shown, these would be the upper and lower boundaries for any outliers.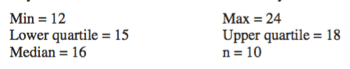
22.5 and 10.5
400
This would be the interpretation of the slope in the equation shown. Height in feet, age in years.
height = 0.29 + 0.48(age)
On average, the height increase 0.48 feet for every additional year in age.
400
This occurs when a change in a response variable is a result of something other than the explanatory variable.
What is confounding?
400
This is the fraction of homeowners who have 4 or more credit cards who have owned their current home for at least one year?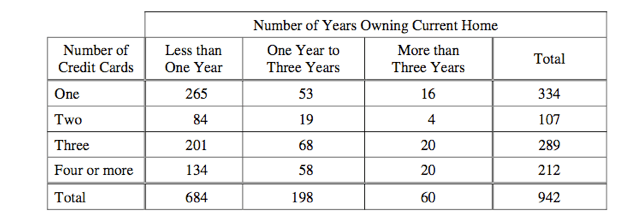
What is 78/212?
400
This is the "Large Enough for Normality" condition for a 1-proportion z-test.
What is "at least 10 success and 10 failures" or "np > 10 n(1-p) > 10"?
500
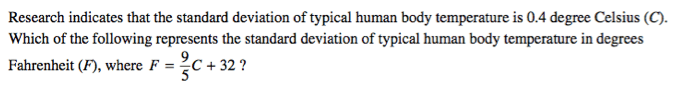
What is (9/5)(0.4) or 0.72.
500
The computer output below gives the regression data for a set of bivariate data. For this data, this is the percent of variation in the y-variable that can be attributed to the LSRL relationship with the x-variable.
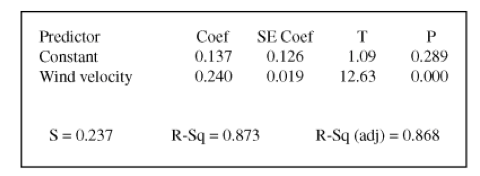
What is a 87.3%?
500
This is likely to result when a sampling method is used that produces samples that do not represent the entire population.
What is bias?
500
Two fair 4-sided dice are tossed. The numbers facing down are multiplied. Given that the product was greater than 3, what is the probability that the toss resulted in a value of 4?
What is 2/10? (or 1/5 or 20%)
500
This is the z* (z-critical) value for a 93% confidence interval.
What is 1.81?