One/Two Variable Data
Sampling and Experiments
Probability
Sampling Distributions & Confidence Intervals
Significance Tests
100
How to describe a distribution
SOCS + context?
Shape (Symmetry)
Center (Mean/Median)
Spread (Range, Standard Deviation, IQR)
Outliers (Are there outliers?)
Place all the above in context.
100
Describe the following sampling methods:
Convenience Sample
Voluntary Response Sample
Simple Random Sample
Convenience Sample: Simply selecting people that are available at the time.
Voluntary Response Sample: Individuals choose to be involved in the study.
Simple Random Sample: Every member of the population has an equal chance of being selected.
100
What are the 3 types of visuals you can use to help with probability?
Tree diagram, Venn diagram, Tables
100
What is P.A.N.I.C.?
P- parameter statement (sentence telling reader what you are trying to find)
A-assumptions and conditions
N-name the interval
I-interval (do the math)
C- conclusion
100
What is Type 1 error? Type 2 error?
and what is the probability of Type 1 error?
A Type 1 error is when the null hypothesis is true, but you reject it. The probability of error is equal to the alpha level.
A Type 2 error is when the alternative hypothesis is true, but you fail to reject the null hypothesis.
200
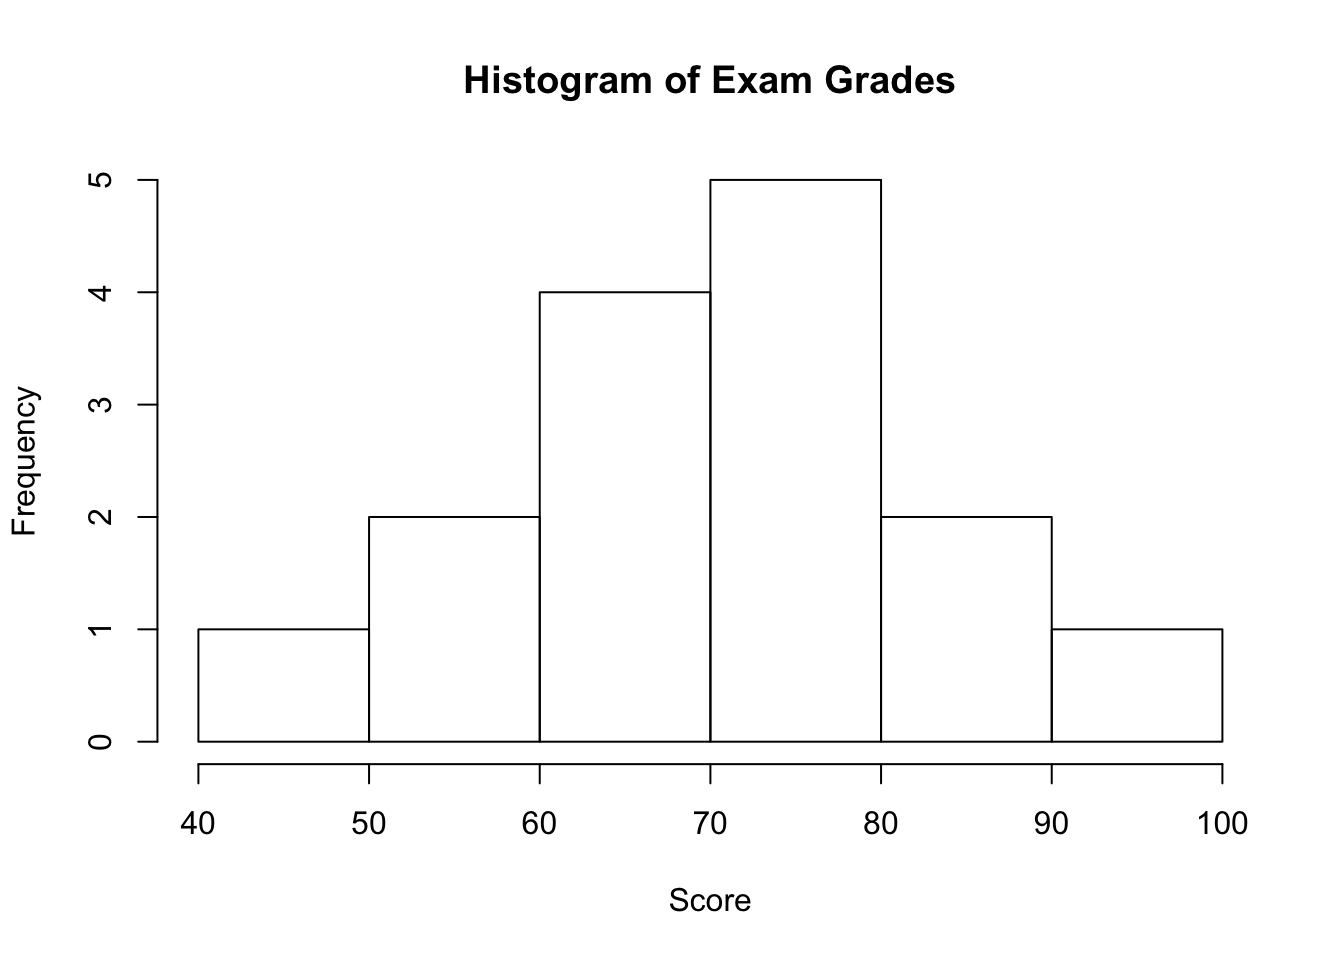
A high school statistics teacher recorded her student's final exam grades (measured in points) for fun. Describe the distribution.
The distribution of the student's exam grades is fairly symmetrical. The median student exam grade is between 70 and 80 points. The range of the student exam grades is 60 points and there seems to be no outliers.
200
Explain the following biases:
Undercoverage bias
Nonresponse bias
Response bias
Undercoverage bias is when people cannot respond.
Nonresponse bias is when people do not respond.
Response bias is when people are untruthful about their responses.
200
Describe the following rules:
Complement Rule
Addition Rule
Multiplication Rule
Complement Rule: The probability of an event occurring is 1 minus the probability that it doesn't occur.
Addition Rule: For 2 disjoint events A & B, the probability that one or the other occurs is the sum of the probabilities of the 2 events.
Multiplication Rule: For 2 independent events A & B, the probability that both A & B occur is the product of the 2 events.
200
What is the parameter, statistic, shape, center, variability, and z-score formula for a sample proportion?
parameter - p - population proportion
statistic - p̂ "p hat" - sample proportion
shape - approximately normal if passes success/failure condition (np and nq are greater than or equal to 10)
center - μ p hat = P
variability - σ p hat = √ (pq/n)
z score formula - (p hat - p)/ (pq/n)
200
How do you decide between a 2-sample for difference of means or 1-sample mean of differences?
Ask yourself: "Does it make sense to find the difference for the original data?"
300
What six values can you determine from a boxplot?
The minimum value, the first quartile, the median, the third quartile, the maximum, and the IQR (interquartile range)
300
What are the elements of an experiment?
An experiment requires...
random assignment of subjects
must identify one explanatory factor to manipulate
must identify response variable to measure
must identify subjects
AND MOST IMPORTANTLY include a treatment
300
What are the conditions for a geometric distribution?
Binary (there is only success and failure)
Independent
First Success (It ends with the first success "until he lands it")
Same Probability of Success in Each Trial
300
What is the parameter, statistic, shape, center, variability, and z-score formula for a sample mean?
parameter - μ - population mean
statistic - x̄ - sample mean
shape - approximately normal if...
(1) population is approx. normal
(2) n is greater than 30 (by the Central Limit Theorem)
(3) sample shows no strong skew
center - μx̄ = μ
variability - σx = σ/√ n
z score formula - (x̄ - μ)/(σ/√ n)
300
What is the key wording for you to know to conduct a significance test?
"Do the data provide convincing evidence?" Significance tests that ask if there is a 'difference' in parameters are two-sided tests.
400
How to describe a distribution (pt.2)
DUFS + context
Direction (positive/negative)
Unusual Features (outliers or clusters)
Form (linear or nonlinear)
Strength (weak, moderate, strong)
400
What is a confounding variable?
A variable that influences both the dependent variable and independent variable, causing a false association
400
How are the mean, standard deviation, and variance affected by multiplying/dividing? adding/subtracting?
If multiplied/divided, the mean, SD, and variance are all multiplied and divided. If added/subtracted, only the mean is affected. There is no change in SD or variance.
400
A polling agency showed the following two statement to a random of 1048 adults in the US.
Environmental statement: Protection of the environment should be given priority over economic growth.
Economy Statement: Economic growth should be given priority over protection of the environment.
The order in which the statements were shown was randomly selected for each person in the sample. After reading the statements, each person was asked to choose a statement that was most consistent with their opinion. The results are shown below:
Environmental Sample - 58%
Economy Sample - 37%
No Preference-5%
Assume the conditions for inference have been met. Construct and interpret a 95% confidence interval for the proportion of all adults who would have chosen the economy statement.
I will construct a one sample z interval for p.
p=the true proportion of US adults who would choose the economy statement
population: all US adults
show your work, but it should be set up like this
0.37 +/- 1.96 √ (0.37 x 0.63)/1048
=(0.3408, 0.3992)
I am 95% confident that the true proportion of US adults that would have chosen the economy statement is between 34.08% and 39.92%
400
Tumbleweed, commonly found in the western United States, is the dried structure of certain plants that are blown by the wind. Kochia, a type of plant that turns into tumbleweed at the end of summer, is a problem for farmers because it takes nutrients away from soil that would otherwise go to more beneficial plants. Scientists are concerned that kochia plants are becoming resistant to the commonly used herbicide, glyphosate. In 2014, 19.7 percent of 61 randomly selected kochia plants were resistant to glyphosate. In 2017, 38.5 percent of 52 randomly selected kochia plants were resistant to glyphosate. Do the data provide convincing statistical evidence, at alpha level 0.05, that there has been an increase in the proportion of all kochia plants that are resistant to glyphosate?


Because the p-value is less than α = 0.05, there is convincing statistical evidence to conclude that the proportion of resistant plants in the 2017 population of kochia plants is greater than the proportion of resistant plants in the 2014 population of kochia plants.
500
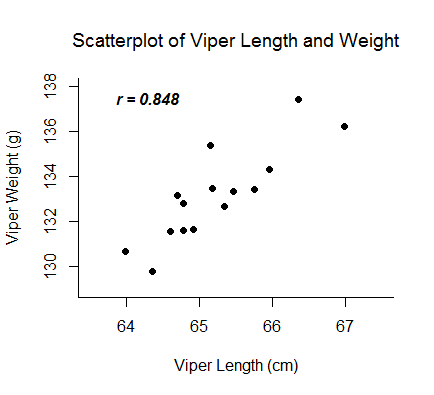
A scientist wanted to compare viper length and weight to see if there was a relationship. Describe the distribution.
There is a strong, positive, linear relationship between viper length and viper weight with no outliers. This distribution seems to indicate that as viper length increases, the viper weight also increases.
500
Describe the difference(s) between a stratified and cluster sampling method
A stratified sampling method contains homogeneous groups and conducts SRS within each of the groups. A cluster sampling method contains heterogeneous groups and conducts SRS within each of the groups.
500
The number of daily views of a TikTok video follows an approximately normal distribution with a mean of 15,000 and standard deviation of 4,000.
(a) Find the probability that a randomly selected day has more than 25,000 views.
(b) How many views would be in the bottom 5% of all days?
(a) 0.0062096
Draw a normal curve and label it. Find the z-score by... (25000-15000)/4000=2.5 and then using your calculator or table find the area. The area is 0.993790 but remember to subtract it from 1.
(b) 8420 views
Draw a normal curve and label it. Use the z-score formula, but input the given values.
-1.645= (x-15000)/4000
Solve for x
500
Patients with heart-attack symptoms arrive at an emergency room either by ambulance or self-transportation provided by themselves, family, or friends. When a patient arrives at the emergency room, the time of arrival is recorded. The time when the patient's diagnostic treatment is also recorded.
An administrator of a large hospital wanted to determine whether the mean wait time (time between arrival and diagnostic treatment) for patients with heart-attack symptoms differs according to the mode of transportation. A random sample of 150 with heart-attack symptoms who had reported to the emergency room was selected. For each patient, the mode of the transportation and wait time were recorded. Summary statistics for each mode of transportation are shown in the table below.

Use a 99% confidence interval to estimate the difference between the mean wait times for ambulance-transported patients and self-transported patients at this emergency room.
I will conduct a 2 sample t interval for μA-μS, the mean difference in mean waiting times.
Random sample: given in question
Independence: assume
Nearly Normal: sample sizes for both are greater than 30 (Central Limit Theorem)
10% Condition - 77 and 73 patients are less than 10% of all patients
Do the math. It should look like this:

We are 99% confident that the true difference in the populations' mean waiting times (ambulance - self) is between -4.3177 minutes and -0.2023 minutes. You can also say that the true mean wait time for those who arrive by ambulance is shorter than those who are self-reported by somewhere between 0.2 and 4.3 minutes.
500

