GRAPHS!!!
Pass the Calc
Probability Probz
Multiple Choice
VOCAB
100
A researcher takes a sample of flowers and measures their heights. If the researcher wants to represent the data in a way that she can still analyze individual values and the shape of the distribution, which is the best way to display it?
I. Histogram II. Stemplot III. Dotplot
a) I only
b) I & II
c) II only
d) II & III
e) None of these
What is d) II & III?
100
Calculate the IQR for the following data:
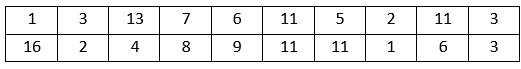
What is 8?
100
P(A and B) = 0
What we call 2 events that cannot occur at the same time.
What is mutually exclusive or disjoint?
100
Which measure of center is best for skewed data?
a. Mean
b. Median
c. Standard Deviation
d. IQR
e. Mode
What is a) mean?
100
A ______ examines every individual within a population.
What is a census?
200
The only quantitative graph that shows true outliers.
What is a boxplot?
200
The average weight of dogs that come to a certain vet's office is 55.6 lbs, with a standard deviation of 2.2 lbs. If the weights are normally distributed, what percent of dogs weigh more than 60 lbs?
What is about 2%?
0.0228 = 2.28%
200
A survey was conducted at the Galleria of 1,000 random shoppers on what they were shopping for and their gender.
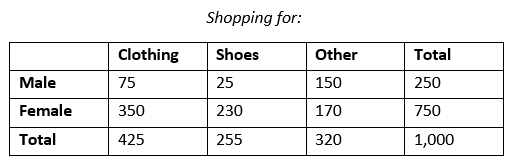
What is the probability that we randomly choose a female who is shopping for shoes?
What is 230/1000 = 0.23 = 23%?
200
The relationship between the amount of time spent working, q (in hours), and expected grade on a group presentation in a random sample of groups among AP Stats students was found to be:
grade = 42.01+9.68(q)
How will a group's expected grade be affected if they work on the presentation for 3 more hours?
a) Their expected grade will go up by 32.33 points.
b) Their expected grade will go up by 29.04 points.
c) Their expected grade will remain unchanged.
d) Their expected grade will go down by 29.04 points.
e) It cannot be determined from the info given.
What is b)Their expected grade will go up by 29.04 point?
200
Which of the following is NOT an example of a quantitative variable?
a) Height in inches
b) High school GPA
c) Six-digit school ID number
d) IQ score
e) Age
What is c) six-digit school ID number?
300
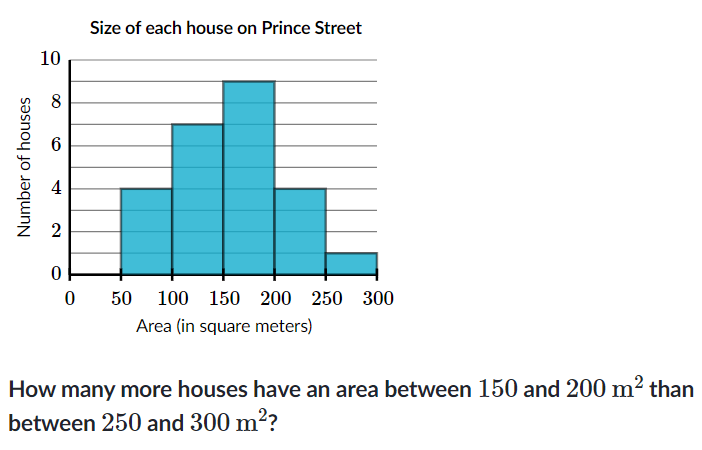
What is 8 houses?
300
A random sample of 10 students was taken and their time they studied (hours) and score on a test was recorded. Here is the data:
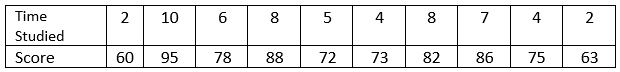
Calculate the equation of the LSRL.
What is y^= 3.96x+55.04?
300
A survey was conducted at the Galleria of 1,000 random shoppers on what they were shopping for and their gender.
 If a shopper is randomly selected,
What is the probability that the shopper if shopping for shoes given the shopper is a female?
What is 230/750 = .3067 = 30.7%?
300
To check the effect of cold temperature on the viscosity of organic and regular honey, one bottle of organic honey and one bottle of regular honey are tested. Fifty milliliters of organic honey are placed in a refrigerator for 5 hours and 50 ml of regular honey are set at room temperature. The mean amount of viscosity is measured for each and compared. Is this a good experimental design?
a) No, bc the means are not proper statistics for comparison.
b) No, bc more than two types of honey should be used.
c) No, bc more temperatures should be used.
d) No, bc temperature is confounded with type of honey.
e) Yes.
What is D?
300
Two events A and B are ___ if and only if
P(A|B)=P(A) and P(B|A)=P(B).
What is independent?
400
The following box plot shows the number of years of experience for each Carlson High School teacher.
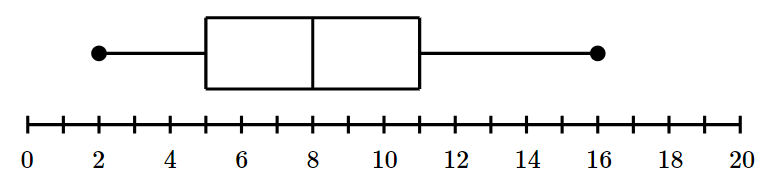
About what percent of Carlson High School teachers have more than 11 years of experience?
What is 25%?
400
Jin recorded the ages (in years) for a sample of 4 zebras from a wildlife preserve. Here are the ages:
2, 9, 14, 15
The mean of these ages is 10 years.
What is the standard deviation?
Round your answer to two decimal places.
What is 5.94 years?
400
A civics teacher asked her students to indicate whether they believed each of two headlines. One headline was false and the other was true, but the students did not know this. The probability that a student selected at random believed the true headline was 90% and the probability that the student believed the false headline was 82%. She found that 75% of the students believed both headlines.
Find the probability that a randomly selected person from this sample believed the true headline OR believed the false headline.
What is 97%?
400
Ava is considering moving to a neighborhood in a different city and state than where she currently lives. To better understand home prices in that area, she looks up the values for a large random sample of homes in that city and calculates their average price.
Ava can safely generalize this result to which population?
a) Only homes in the sample
b) All homes in that neighborhood, but not the entire city
c) All homes in that city, but not the entire state
d) All homes in the entire state, but not the entire country
e) All homes in the entire country
What is c?
Since the sample was randomly selected from all homes in that city, the results can safely be generalized to this population.
400
The numeric value that describes the strength and direction of a linear relationship between two quantitative variables.
What is r (correlation)?
500
The histogram summarizes the ages of the 1000 students at Noa's college.
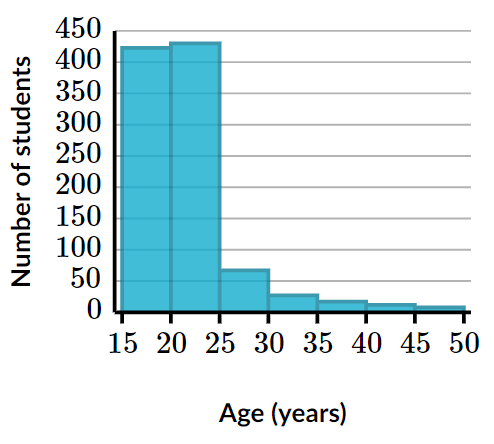
Which interval contains the 40th percentile for this data?
What is 15-20 years?
500
Students applying to a certain military academy must take a fitness test. One component of the test has applicants complete as many sit-ups as possible in fixed amount of time. Here are some summary statistics for the sit-ups portion of the fitness test:
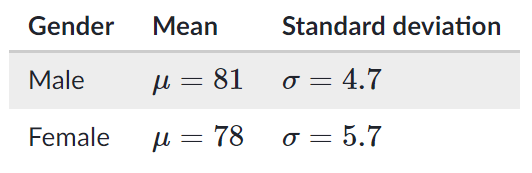
John and Daniela both completed 85 sit-ups on the fitness test.
Relative to their gender, who completed more sit-ups?
Who is Daniela?
John's z-score = .85 while Daniela's z-score = 1.23
500
The probability that there will be a tornado in Tulsa, OK each day of the summer depends on the humidity of the day. If the air is dry on a given day, there is a 0.5% chance of a tornado in Tulsa; if the air is humid on that day, there is a 5% chance of a tornado. On 7/1/19, local news reported that there was a 40% chance of the air being humid. What is the probability that there was a tornado in Tulsa on that day? (Hint: tree diagram)
a) 0.003
b) 0.020
c) 0.023
d) 0.040
e) 0.060
What is c) 0.023?
500
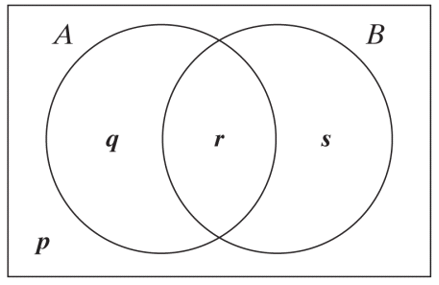
Find P(B|A).
a) s
b) s-r
c) s/r
d) r/(q+r)
e) (r+s)/(q+r+s)
What is d) r/(q+r)?
500
The difference between the actual data value and the predicted value using a LSRL.
What is a residual?