Data
Boxplots
Investigative Question
Distributions
Experimental Design
Graphical Displays
Sampling
100
What the median represents
The data point located at 50% of the data
100
The 5 number summary
Minimum, Quartile 1, Median, Quartile 3, Maximum.
100
Key word you should always include when writing the population
All
100
What CCUSS & BS stands for
C - Context
C - Center
U - Unusual
S - Shape
S - Spread
BS - Be Specific
100
Coin flip =
Random Assignment
100
Graphs with 2 peaks
Bimodal
100
4 types of Sampling
Simple Random Sample (SRS),
Stratified,
Cluster,
Systematic
200
Data type for 'Breed of Dog'
Categorical
200
The formula for range
Max-Min
200
Variable that explains the response
Explanatory Variable
200
2 words that represent Center
Mean/Median
200
Treatments ≠
Blocks
200
Type of Skew for Department B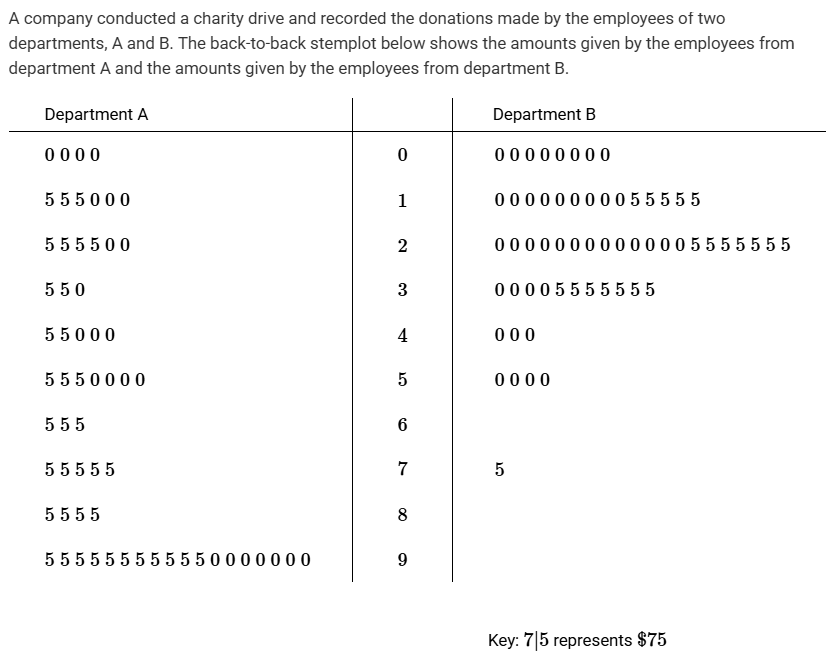
Skewed Right
200
Grouping participants based on similar characteristics and randomly selecting from each group
Stratified Random Sampling
300
Data type for 'Height'
Quantitative Continuous
300
The IQR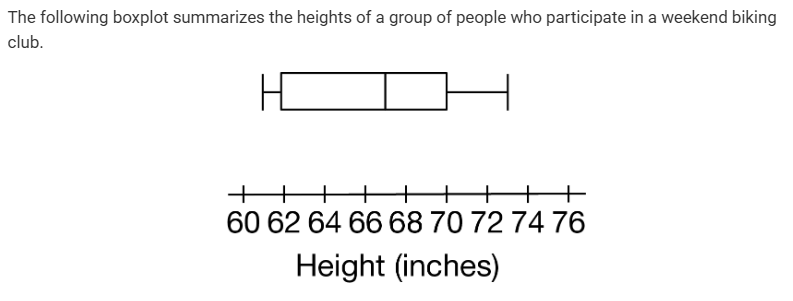
8
300
The 5 parts of an investigative question
Population, Explanatory Variable, Parameter, Direction, and Conclusion
300
Type of skew where mean < median
Skewed Left
300
When each treatment uses enough participants in each group
Replication
300
Just before graduation, a random sample of high school seniors were asked what their plans were for the coming year. A year after graduation, those same individuals were asked what their main activity was in the year after graduation.
True or False: After graduation, the percentage of students who selected College as their main activity was twice the percentage of those who selected Work as their main activity.
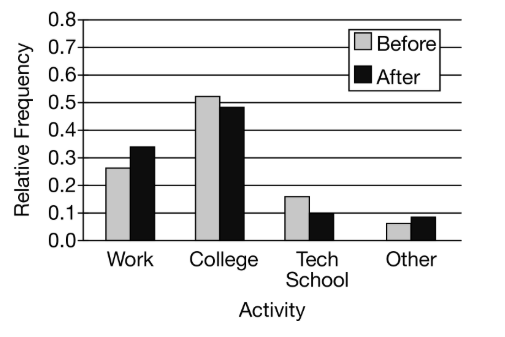
False
300
Randomly selecting the 4th person and then selecting every 3rd person after them
Systematic Sampling
400
Data type for 'Number of Sibilings'
Quantitative Discrete
400
The formulas for the lower and upper bounds
Lower: Q1 - 1.5(IQR)
Upper Q3 + 1.5(IQR)
400
Component that usually contains "less than", "greater than", "difference"
Direction
400
Formula for Z-Score
(x-m)/sd
400
Grouping participants based on similar characteristics for an experiement
Blocking
400
IQR of Distribution
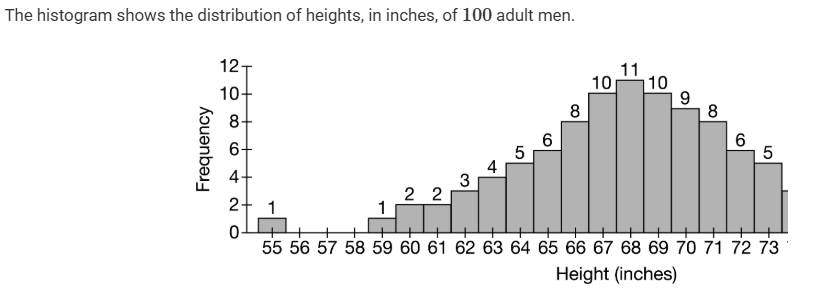
5
400
Randomly selecting multiple groups of participants
Cluster Random Sampling
500
Percentage of data points located at atleast Quartile 1
75%
500
What IQR stands for
Interquartile Range
500
Conclusion when there's an experimental study
Cause/Causation
500
3 words that represent Variability
Spread/Range/IQR
500
3 components of a well-designed experiment
Random Assignment, Replication, Comparison
500
The lower and upper bounds for these summary statistics
Lower = -67.5
Upper = 192.5
500
Causes sample to not be representative of the population
Bias
600
The basic entity or element being measured or observed
Statistical Unit / Experimental Unit / Observational Unit
600
Construct a Boxplot for data in this dotplot
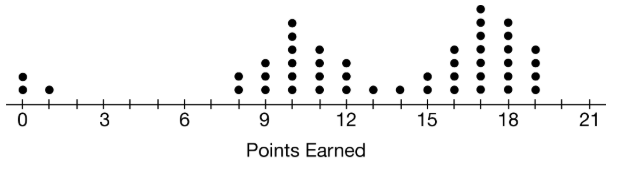
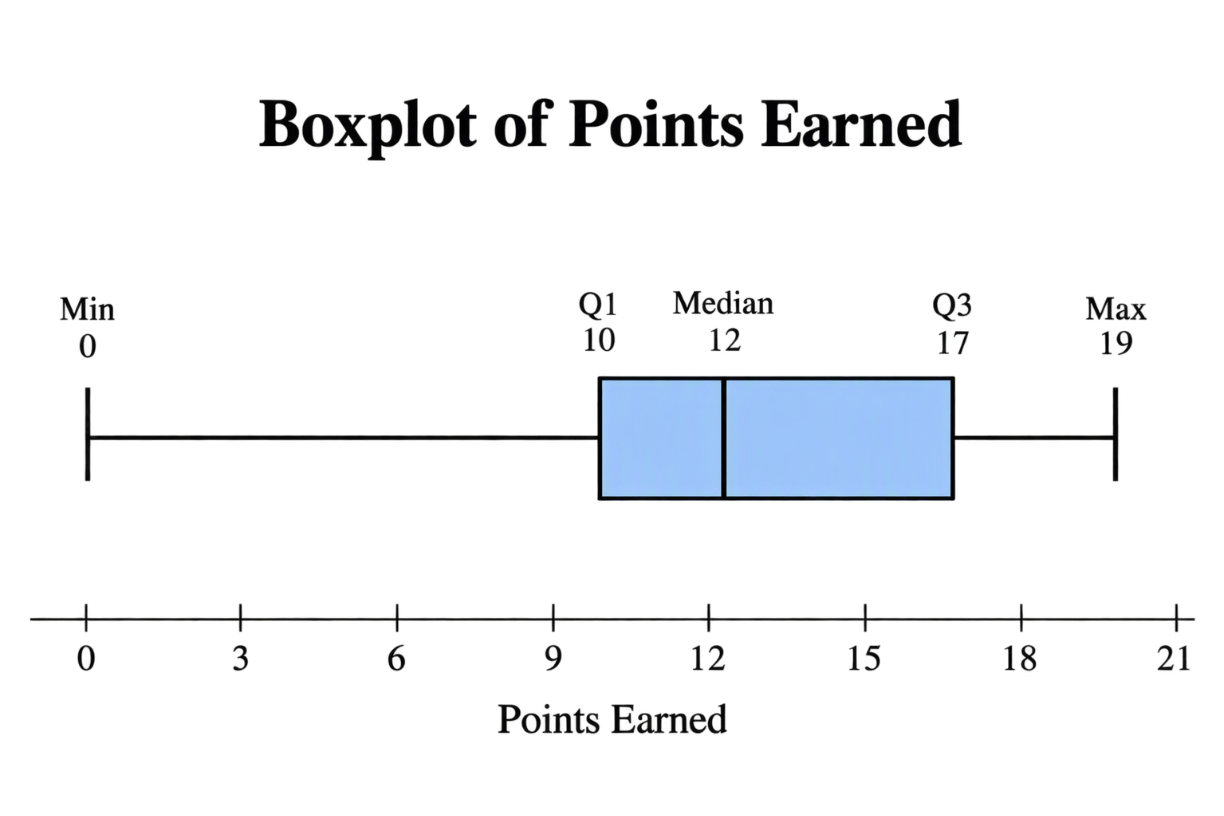
600
Population to generalize to when participants are not randomly selected
All participants similar to those in this study
600
Also called a Symmetrical Distribution
Normal Distribution
600
Allows for generalization to population for experiements
Random Assignment
600
Skew of the data
Skewed right
600
When people chosen for a survey choose not to answer
Nonresponse Bias