Vocab
Describing Distributions
Graphs
Empirical Rule and Z-Score
Other/Problems
100
Definition of statistics
What is the study of data?
100
The 4 ways to describe a distribution.
What is SOCS ( Shape, Outliers, Center, Spread)
100
The lines in a bar graph touch.
TRUE or FALSE
What is FALSE?
The lines in a histogram touch.
100
Another word for z-score.
What is a standardized score?
100
The values of the mean and standard deviation in a standard normal curve.
What is 0 (mean) and 1 (sd)?
200
Definition of percentile.
What is the percent of data that falls below a value?
200
The measure of center that is non-resistant and the measure of center that is resistant.
What is the mean and the median?
200
When graphing, the variable that goes on the y-axis and the variable that goes on the x-axis?
No, the dependent variable and the independent variable are not the correct answers.
What are the response variable (y) and the explanatory variable (x)?
200
State when normalcdf is used vs when invNorm is used.
What is normalcdf is used when you have the data (z-score or mean) and invNorm is used when you have the area under the curve as a percentage?
200
State how many of the following are categorical and how many are quantitative.
Color
Money
Temperature
Day of the week
Time
What is 2 categorical and 3 quantitative?
300
State the difference between discrete and continuous variables.
What is discrete variables are numerical values where counting makes sense (no decimals) and continuous variables are numerical values where decimals are appropriate (measuring)?
300
The 6 shapes used to describe distributions
What is the Unimodal, Bimodal, Uniformal, Symmetric, Left Skewed, Right Skewed,
300
State whether the barline includes or excludes the value on the tick mark in a histogram.
What is the barline excludes the value on the tick mark in a histogram?
300
State the empirical rule.
What is 68–95–99.7?
*99 is okay
300
State how many of the following are discrete variables and how many are continuous variables.
Color
Money
Temperature
Day of the week
Time
What is 1 discrete and 2 continuous?
400
The definition of z-score
What is the number of standard deviations a data point is away from the mean?
400
State the relationship between the median and the mean in a left-skewed distribution. (using >, <, or =)
What is median > mean?
OR
What is mean < median?
400
State the difference between a boxplot and a modified boxplot.
What is a boxplot includes the outliers and a modified boxplot identifies the outliers by marking them with dots/stars beyond the "whiskers"?
400
Three measures of data that have to be equal in a normal distribution.
Mean, median, mode
400
Percentage shaded
*Imagine it's shaded from -2 to 1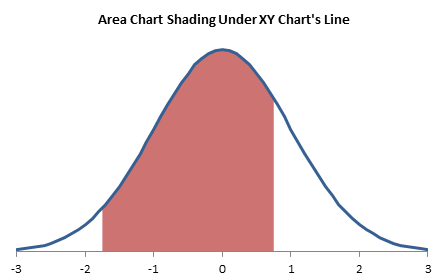
What is 82%?
500
Another word for cumulative relative frequency graphs and its definition.
What are ogives and display percentiles?
500
State when the standard deviation should be used as the measure of spread.
What is when the mean is the chosen measure of center?
The median would be used when the IQR is the chosen measure of center.
500
State 5 types of graphs/plots (excluding distributions).
What is... (any 5 below is correct)
Bar graph
Histogram
Cumulative relative frequency graph
Stemplot
Boxplot
Dot plot
?
500
State the formula for finding the z-score.
What is 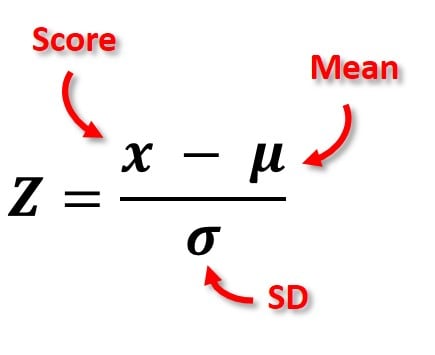 ?
?
500
State what is wrong with this graph.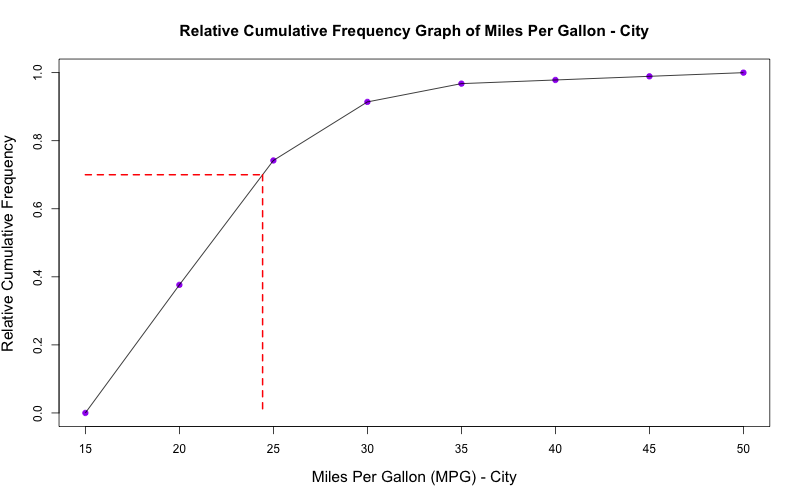
What is there is no zig-zag line at the beginning of the graph from the origin to the first point?