Vocabulary I
Vocabulary II
Graphs
Math
FRQ Practice
100
These species are characterized by a smaller range of tolerance, or narrower ecological niche, making them more prone to extinction.
Specialist Species
100
This term indicates the maximum number of individuals in a population that an ecosystem can support
Carrying Capacity
100
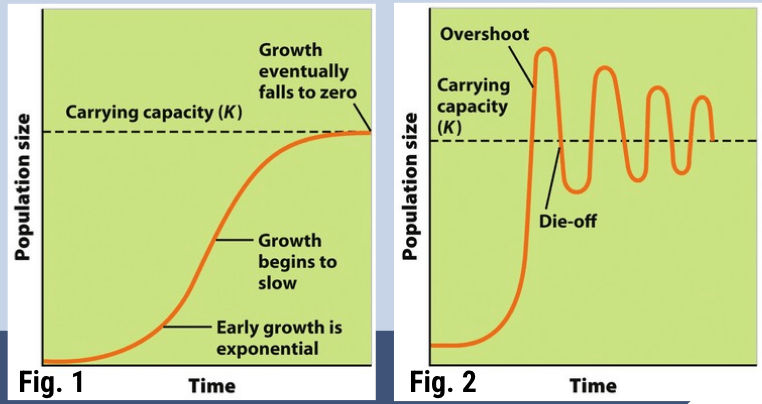
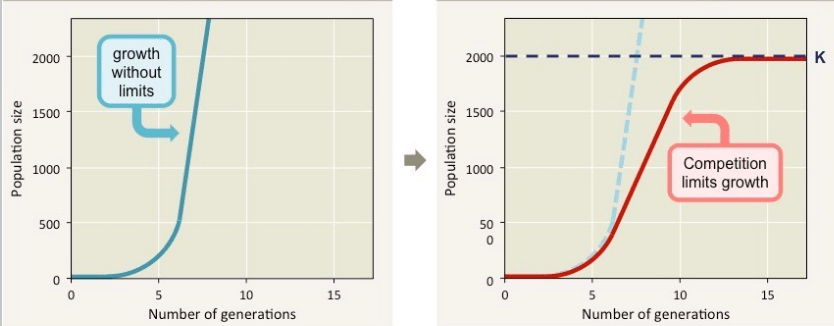
Explain the difference between these two graphs.
Both graphs depict carrying capacity.
Figure 1 is theoretical. It shows that populations grow exponentially, then slows down until they hit carrying capacity, after which population growth stops and the population remains constant.
Figure 2 is realistic. It shows that populations grow exponentially, and overshoot carrying capacity. Eventually there is massive die off due to overconsumption of resources. Now that there is an abundance of resources relative to the population, the population rises and overshoots again. This pattern of overshoot and die off around the carrying capacity continues indefinitely.
100
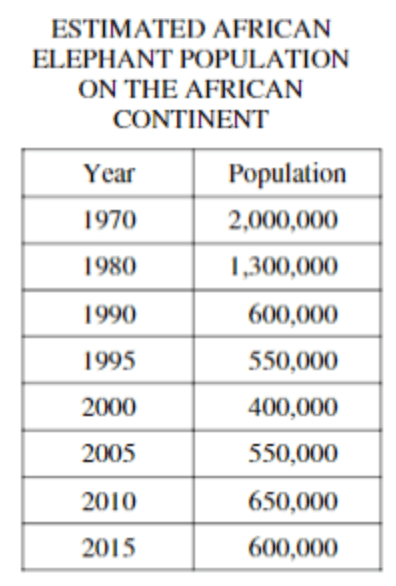
Calculate the percent change in African elephant population from 1970 to 2000.
80%
100
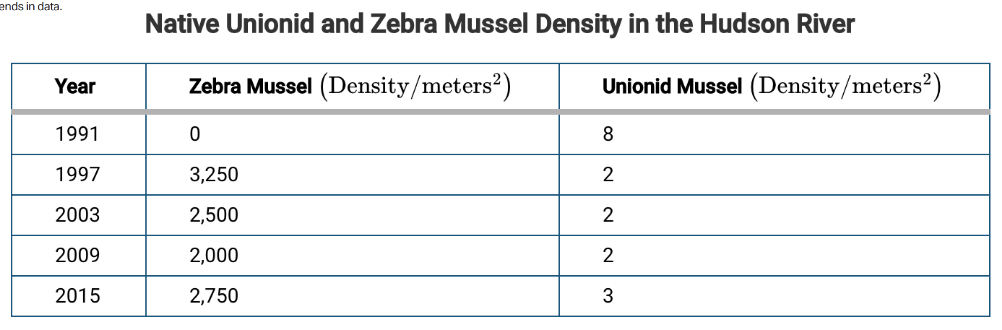
Describe the relationship between Zebra Mussel and Unionid Mussel population density in the Hudson River
Inverse Relationship
Generally, when there were more zebra mussels, there were less unionid mussels in the Hudson River.
200
These species are characterized by a larger range of tolerance, and a broader niche, making them less prone to extinction & more likely to be invasive
Generalist Species
200
Factors that influence population growth based on size:
Ex: food, competition for habitat, water, light, and disease
Density- Dependent factors
200
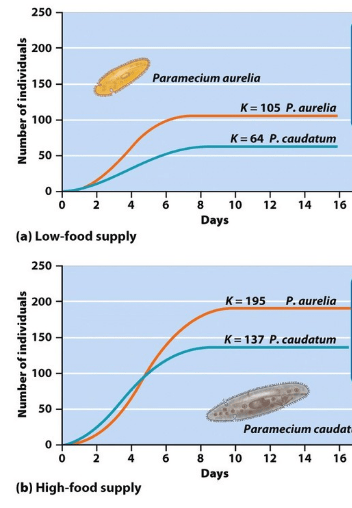
How does this graph support that food availability is a major factor affecting population.
The number of individuals of both species is higher when there is high- food supply.
200
In 2019, Charlotte had a growth rate of 1.88% calculate the year the population will be double if the rate stays constant.
2056
200
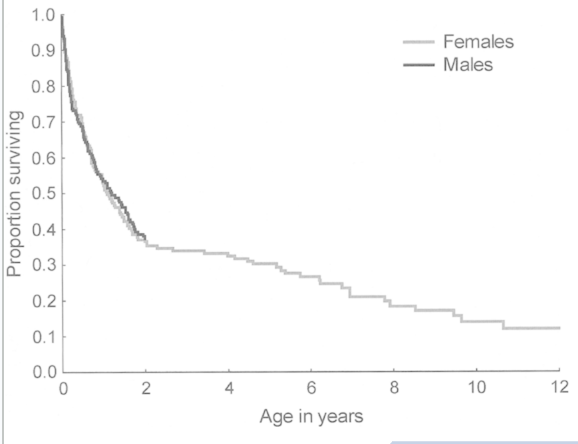
Describe the trend in survivorship shown in this graph. Identify which type of survivorship curve this data represents.
The survivorship drastically drops to ~35% in the first 2 years. The population decreases at a constant rate afterwards.
Type 3 survivorship curve
300
These species have/ are:
Few offspring
Heavy parental care
Fewer reproductive events
Long lifespan
Later sexual maturity
- More likely to be disrupted by environmental change or invasive species
K- selected Species
300
This number, indicates the minimum TFR required to keep a population from declining.
What is the term used to describe this number?
2.1
Replacement Level Fertility
300
Which graph represents biotic potential? Blue or Red.
Blue
300
A certain species has a current population of 600,000. It is predicted that the population will decline by 20% in 7 years. What will be the species' new population in 7 years?
480,000 individuals
300
If there are no predators of deer in a forest, explain why the density of the deer population will reach a level where the density will not increase further.
The deer will deplete the ecosystem of resources and the population will overshoot, then decline, consistently fluctuating around the ecosystem's carrying capacity.
400
These species have/ are:
Many offspring
Little to no parental care
Generally reproduce many times throughout lifespan
Shorter lifespan
Early sexual maturity
High biotic potential
High population growth rate
More likely to be invasive
r- selected Species
400
This scientist claims that Earth has a human carrying capacity, probably based on food production
Thomas Malthus
400
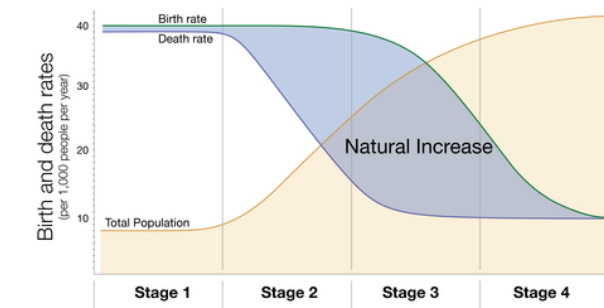
Describe what is happening to birth rate, death rate, and total population during Stage 3.
Birth Rate: High, begins to rapidly decline
Death Rate: Low, slowly decreasing
Total Population: Slowly increasing
400
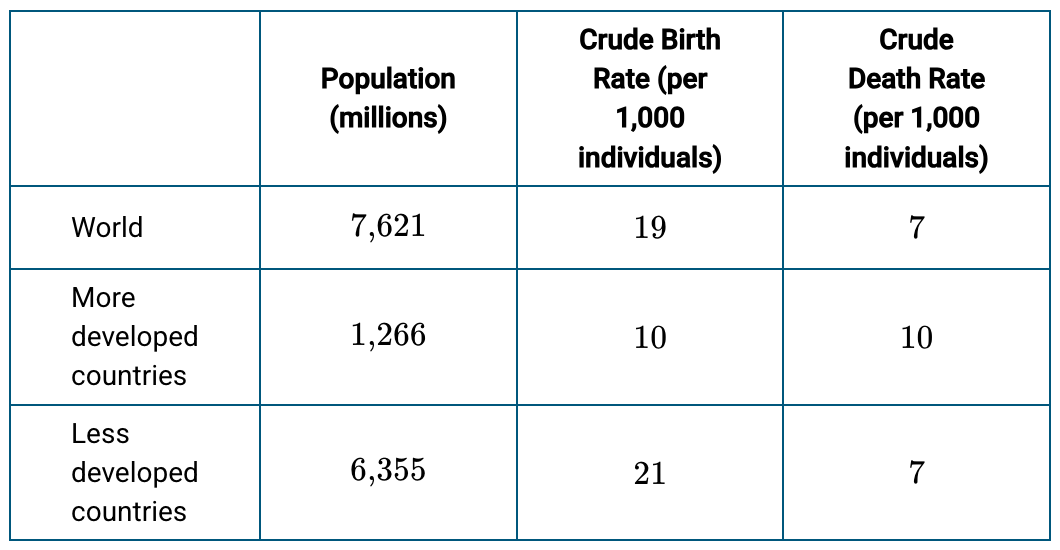
Calculate the population growth rate for less developed countries.
1.4%
400
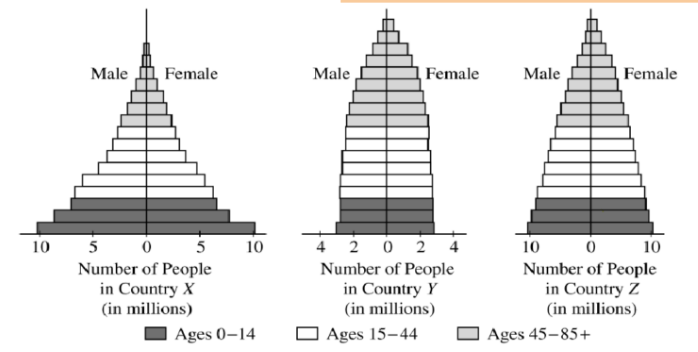
Identify the country with the slowest population growth rate.
Explain your answer
CLAIM: Country Y.
EVIDENCE: The shape of Country Y's age- structure diagram is less pyramidal than the others; this Country has a pretty equal proportion of individuals in the pre- reproductive and reproductive cohorts, before more die out begins in the post- reproductive cohorts.
REASONING: This means that when reproductive aged people reach post- reproductive age and begin to die off more, the pre- reproductive aged population will replace them, but there wont be many babies born to replace the aging population.
500
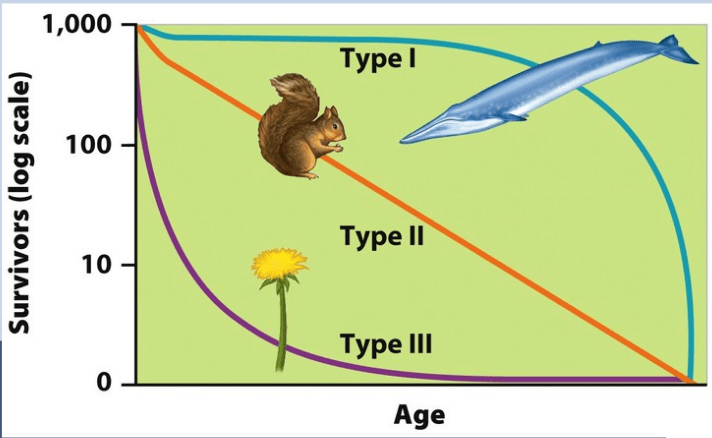
This type of graph illustrates the average amount of survivors of a species in an age cohort throughout throughout their lives.
Survivorship curve
500
This stage is characterized by:
High IMR &
High death rate
High TFR
Stage 1- Pre- Industrial
500
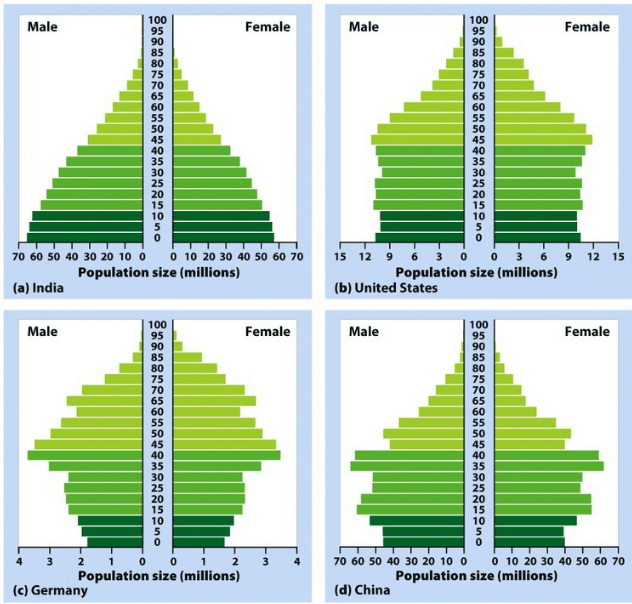
Identify the country with the lowest growth rate.
Germany
500
If a country has a growth rate of 1.2% how long will it take to double its population?
58.3 years
500
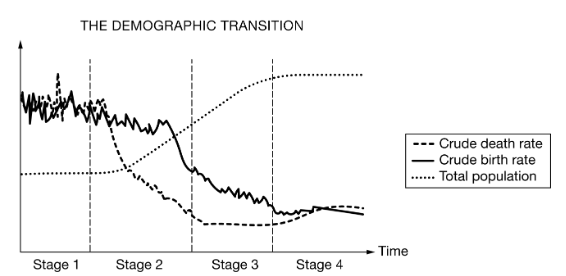
Describe the relationship between the CBR and CDR that led to the trend in total population in Stage 2
CDR decreased rapidly, while CBR decreased much slower and remained relatively high, causing the population to grow exponentially.