What is a blind experiment?
Experiments in which information about the test is kept from the participants to reduce bias.
Which variable in the experiment (see board) is being tested(and thus is the desired variable)?
Type of light the plants recieve (sunlight or florescent)
What is a legend?
Gives you information about the graph so you can understand the parts.
(a key to the colors or representations)
What type of graph uses percentages?
Pir or circle graphs
When did the candle burn the longest? When placed under a small glass or a large glass.
Large glass
What is a double-blind experiment?
Experiments in which neigher the experimenters nor the particpants knw the objects' indentitis in the setup.
Why would you want to use a double blind experiment?
To make sure the person presenting the experiment doesn't skew the data by changing their facial expression or voice tone or how they present the test.
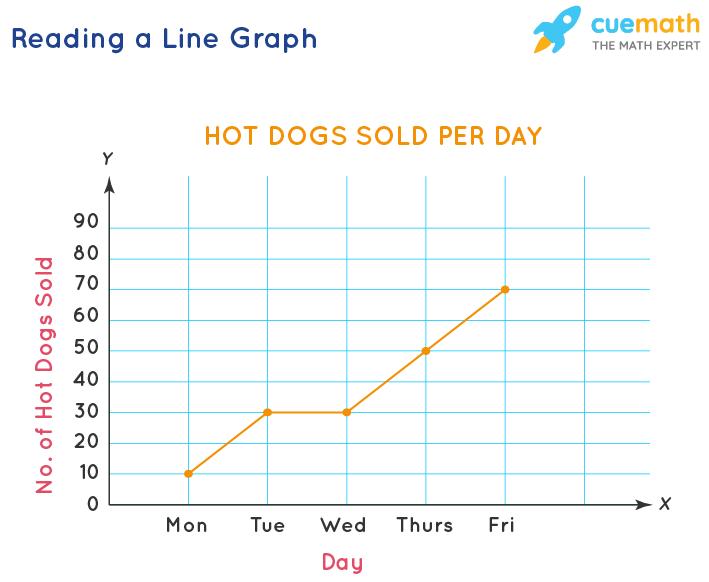
What are the 3 labels that must go on a line and bar graph?
Title, x-axis, and y -axis
Which type of graph records individual data as points on a graph?
Line graph
Name the experimental variable in the egg, water, salt lab
Amount of salt
What is the Control of an experiment?
The variable of part of an experiment to which all others will be compared.
Name at least 4 variables that the experimenter tried to reduce or eliminate in the plant sudy.
-type of plant, age of plant, amount of water and amount of light exposure

What is the label for the x-axis?
Day
What are tally marks?
Lines used to make groups of 5 so it is easier to count
Name the control from the candle/jar lab
lighting the candle and watching it first
What is an experimental variable?
Why should you always reduce the number of experimental variables?
It's important to only test 1 thing at a time in order to get a good idea of how that change is affecting the desired outcome.
When labeling measurments, what is important to include and why?
Units of meausre because you need to know what units are being used incase the experiment is repeated
Which type of graph enables you to show the relative size of different categories?
Bar graph
Why did the candle burn out when a jar was placed over it?
The burning of the candle used up all the oxygen in the jar. Without oxygen combustion doesn't happen
Vertical line on a graph
What is the difference between subjective and objective data?
Subjective is based on the OPINIONS of other people and can vary. SUBJECTIVE data is measurable data.
Create a table from this information (see white board).
See teacher table.
When would you use a double bar graph?
When comparing the relative sizes of 2 sets of data.
In the demonstration with the colored water and candle, why was water sucked up into the glass after it burnt out?
When the oxygen is used up, a void is left in the jar that becomes filled with water