Bias
Statistics
Central Tendencies
Ethics
Miscellaneous
100
Tendency to seek evidence that confirms belief
Confirmation bias
100
A bar graph depicting a frequency distribution
Histogram
100
Statistical methods used for finding the center of a distribution
Central tendencies
100
Reviews methods proposed for research to ensure that they are ethical
Institutional Review Board (IRB)
100
Rare or extreme events are likely to be followed by more typical ones
Regression toward the mean
200
Recently acquired knowledge influences the recollection of past information
Hindsight bias
200
Tabular (in a table) representation of the number of times a specific value occurs
Frequency distribution
200
Sum of all numbers divided by the number of scores
Mean
200
Determines ethical guidelines
American Psychological Association (APA)
200
Indicates how many of the 100 scores are at or below a particular score
Percentile rank
300
Tendency to overestimate the accuracy of our beliefs and judgments
Overconfidence
300
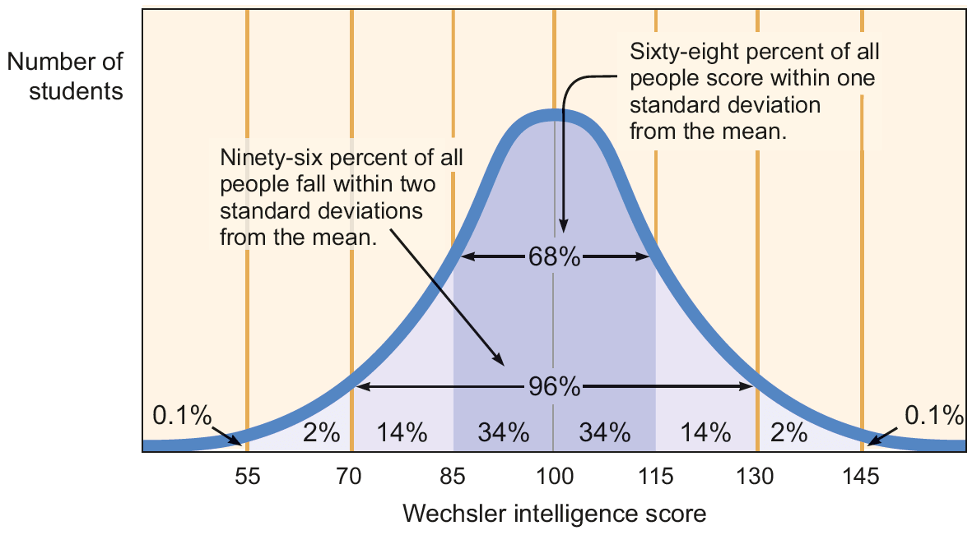
Normal distribution
300
Half of the scores are above it, and half are below it
Median
300
Data about research participants is never discussed or released
Confidentiality
300
Extent to which research yields consistent results
Reliability
400
An inert (“fake”) substance presented to a control group
Placebo
400
A frequency distribution with few low scores and displays as high on right
Negatively skewed distribution
400
Most frequently occurring score
Mode
400
Lacking significant risk or harm
Nonmaleficence
400
Extent to which research measures what it is suppose to
Validity
500
List three techniques experimenters can use to eliminate bias
Replication, counter-balancing, single blind, or double-blind
500
Measure of how much scores vary around the mean
Standard deviation
500
Difference between highest & lowest scores in a distribution
Range
500
Post-experimental explanation of a study to its participants which includes the study’s purpose and any deception used
Debriefing
500
A “p” value of .05 indicates a 1 in 20 (5%) chance that results are due to chance
Statistical significance