AROC - Equations
Slope- Table
AROC- Graph
AROC- Table/ Function
100
Calculate the average rate of change of the function f(x)=10(1.27)x over the interval [2, 8]. Round to the nearest hundredth.
8.59
100
What is the slope of the ordered pairs (4,-5), (2,7) ?
12/-2 -6
100
Find the average rate of change over the interval 7 < x < 44
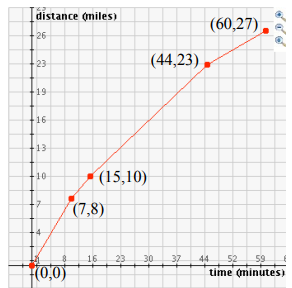
15/37
100
What is the average rate of change over the interval
0 < x < 4 ?

28/4 or 7
200
A fruit fly population is modeled by the equation P=10(1.27)t where P represents the population of flies over t days. What is the average rate of change of the population, rounded to the nearest tenth, over the interval [1, 9.5]?
9.9
200
What is the slope of the ordered pairs (-6,8), (4,8) ?
0/10 or 0
200
What is the average rate of change over the interval 1 < x < 3 ?

-4/2 or -2
200
What is the average rate of change over the interval
20 < x < 26 ?

13/6
300
An initial investment of $1000 reaches a value V(t) according to the model V(t)=1000(1.01)4t, where t is the time in years. Determine the average rate of change, to the nearest dollar per year, of this investment from year 2 to year 7.
$48 per year
300
What is the slope of the ordered pairs (24,19), (8,10) ?
9/16
300
What is the average rate of change over the interval 3 < x < 5 ?
6/2 or 3
300
What is the average rate of change over the interval
2 < x < 5 ?

-16/3
400
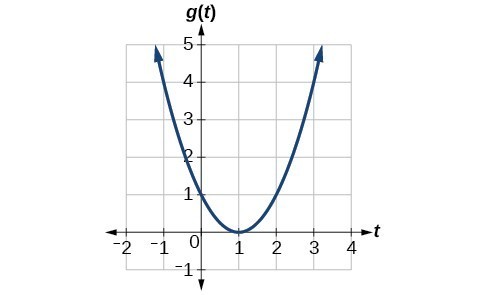
Which function shown below has a greater average rate of change on the interval [-1, 3]? Justify your answer.
g(x) = 4x3 - 5x2 + 3
or
x -1 0 1 2 3 4
f(x) 2.5 5 10 20 40 80
g(x)
400
The following table has a slope of 35. What does this represent in the context of the table?

It cost $35 per hour
400
What is the average rate of change over the interval
-1 < x < 2 ?
-3/3 or -1
400
What is the definition of Rate of Change?
The Average Rate of Change is defined as the average rate at which one quantity is changing with respect to something else changing. In simple terms, an average rate of change is a process that calculates the amount of change in one item divided by the corresponding amount of change in another......or simply stated, (the change in y divided by the change in x.) SAME AS CALCULATING SLOPE.
500
The population of China, in millions, can be modeled by P(x)=316.93e0.0133x where x is the number of years since 1950.
The population of India is summarized in the table below, where x is years since 1950.
x 20 30 40 50 60 70 80
I(x) 268 285 324 376.3 450.6 555.1 699
Which country has a greater rate of change in population between 1980 and 2020?
CHINA
500
The following table has a slope of 2. What does this represent in the context of this table?

It grew 2 mm every day.
It grew 4 mm every 2 days
500
What is the average rate of change over the interval
1 < x < 4 ?
1/3
500
How do you calculate the rate of change from a graph?
Answers may vary.
Utlimately repeating, Calculate the change in y divided by the change in x.