2 circle Venn Diagram
3 circle Venn Diagram
OR & AND
SURPRISE
GIVEN
100
Question #1
50 seniors were surveyed about their after school commitments. 19 work and 27 participate in sports. 8 of them do both.
Draw a Venn diagram to model this information. Then find each probability below.
1). P(neither)
12/50
What is 24%
100
QUESTION 2
100 students were surveyed about their favorite subjects in school. 50 said Math, 35 said Language Arts, 29 said Science and others had trouble deciding. Five liked all three subjects and 6 liked math and science only. Fifteen preferred Science only and 3 liked Math and Language Arts only.
Draw a Venn diagram to model this information. Then find each probability below.
1) How many students did not list math, language arts, or science as their favorite subject?
What is 8?
100
Question #3
Suppose you spin a spinner with three equal sections (red, blue, and yellow) two times.
(a) Give the sample space for this chance process.
What is RR RB RY BR BB BY YR YB YY ?
100
QUESTION#4
The number of people in the US households have the following probability model:

Suppose that a household of more than 4 people is considered a large household. Randomly select a U.S. household.
(c) Find the probability that the chosen household is a large household.
What is 0.09?
100
A television network conducted a test screening to get audience reactions to their new TV pilot. The researchers used a random sample of 50 people so that predictions could be made from the data. The results of the survey are below.

4) P( Male | Likes Pilot)
What is 14/35 ?
40%
200
Question #1
50 seniors were surveyed about their after school commitments. 19 work and 27 participate in sports. 8 of them do both.
Draw a Venn diagram to model this information. Then find each probability below.
2) P(not working)
31/50
What is 62%
200
100 students were surveyed about their favorite subjects in school. 50 said Math, 35 said Language Arts, 29 said Science and others had trouble deciding. Five liked all three subjects and 6 liked math and science only. Fifteen preferred Science only and 3 liked Math and Language Arts only.
Draw a Venn diagram to model this information. Then find each probability below.
2) P(Math and Science)
What is 11/100?
200
Question #3
Suppose you spin a spinner with three equal sections (red, blue, and yellow) two times.
(b) Define event A as spinning blue once. Find P(A).
What is 2/9?
RR RB RY BR BB BY YR YB YY
200
Question #5
A television network conducted a test screening to get audience reactions to their new TV pilot. The researchers used a random sample of 50 people so that predictions could be made from the data. The results of the survey are below.
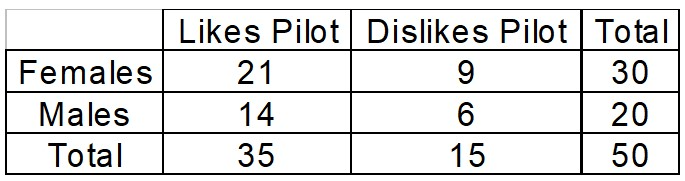
1) P( Female)
What is 30/50?
200
Question #5
A television network conducted a test screening to get audience reactions to their new TV pilot. The researchers used a random sample of 50 people so that predictions could be made from the data. The results of the survey are below.

5) P(Female | Dislikes Pilot)
What is 9/15?
300
Question #1
50 seniors were surveyed about their after school commitments. 19 work and 27 participate in sports. 8 of them do both.
Draw a Venn diagram to model this information. Then find each probability below.
3) P(working given sports)
8/27
What is 29.6%
300
QUESTION #2
100 students were surveyed about their favorite subjects in school. 50 said Math, 35 said Language Arts, 29 said Science and others had trouble deciding. Five liked all three subjects and 6 liked math and science only. Fifteen preferred Science only and 3 liked Math and Language Arts only.
Draw a Venn diagram to model this information. Then find each probability below.
3) P(Science)
What is 29/100?
300
Question #3
Suppose you spin a spinner with three equal sections (red, blue, and yellow) two times.
(c) Define event B as spinning blue at least once. Find P(B).
What is 5/9?
56%
RR RB RY BR BB BY YR YB YY
300
Question #5
A television network conducted a test screening to get audience reactions to their new TV pilot. The researchers used a random sample of 50 people so that predictions could be made from the data. The results of the survey are below.

3) P( Male or Likes Pilot)
What is 41/50?
82%
300
Question #6
One question on the Census at School survey asks students if they would prefer to be happy, healthy, rich or famous. Students may only choose one of these responses. The two-way table below summarizes the responses of 218 high school students from the United States by gender.
Suppose we randomly select one of these 218 students. Define events F: female, H: happy, and R: rich.

(a) Find P(H | F).
What is 90/120 ?
75%
400
Question #1
50 seniors were surveyed about their after school commitments. 19 work and 27 participate in sports. 8 of them do both.
Draw a Venn diagram to model this information. Then find each probability below.
4) P(work or sport)
38/50
4) What is 76%
400
QUESTION #2
100 students were surveyed about their favorite subjects in school. 50 said Math, 35 said Language Arts, 29 said Science and others had trouble deciding. Five liked all three subjects and 6 liked math and science only. Fifteen preferred Science only and 3 liked Math and Language Arts only.
Draw a Venn diagram to model this information. Then find each probability below.
4) P(Language Arts or Math)
What is 77/100?
400
QUESTION#4 The number of people in the US households have the following probability model:

Suppose that a household of more than 4 people is considered a large household. Randomly select a U.S. household.
(a) Find the probability that the number of people in a household is not 4.
What is 0.87?
400
Question #5
A television network conducted a test screening to get audience reactions to their new TV pilot. The researchers used a random sample of 50 people so that predictions could be made from the data. The results of the survey are below.
2) P(Dislikes Pilot)
What is 15/50?
400
Question #6
One question on the Census at School survey asks students if they would prefer to be happy, healthy, rich or famous. Students may only choose one of these responses. The two-way table below summarizes the responses of 218 high school students from the United States by gender.
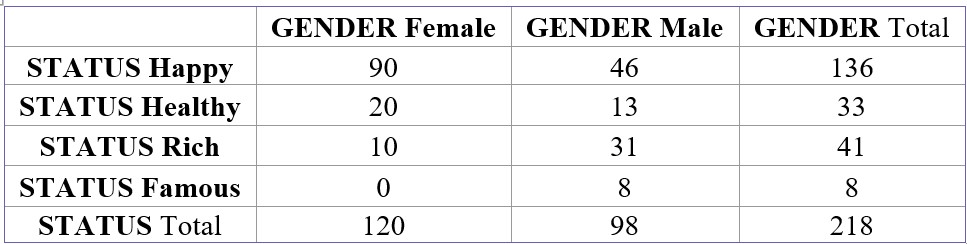
(b) Given that the chosen person did not choose rich, what’s the probability that this person is female? Write your answer as a probability statement using correct symbols for the events.
What is P(F|Rc) ?
110/177
500
BONUS
What is 500?
You get 500 bonus points
500
QUESTION #2
100 students were surveyed about their favorite subjects in school. 50 said Math, 35 said Language Arts, 29 said Science and others had trouble deciding. Five liked all three subjects and 6 liked math and science only. Fifteen preferred Science only and 3 liked Math and Language Arts only.
Draw a Venn diagram to model this information. Then find each probability below.
5) P(Math)c
What is 50/100
500
QUESTION#4
Suppose that a household of more than 4 people is considered a large household. Randomly select a U.S. household.

(b) Find the probability that the number of people in a household is 4 or less.
What is 0.91?
500
QUESTION #2
100 students were surveyed about their favorite subjects in school. 50 said Math, 35 said Language Arts, 29 said Science and others had trouble deciding. Five liked all three subjects and 6 liked math and science only. Fifteen preferred Science only and 3 liked Math and Language Arts only.
Draw a Venn diagram to model this information. Then find each probability below.
6) P(Language Arts or Science)c
What is 44/100?
500
Question #7 Checking for independence
PROBLEM: Data on gender and allergies were obtained from a random sample of 227 students who responded to an online survey on the Census at School website. The data are summarized in the two-way table shown below.
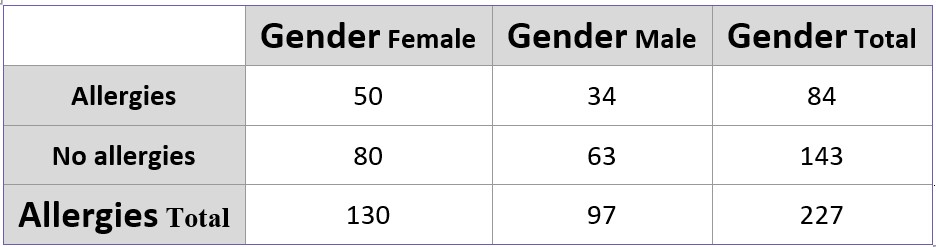
Suppose we choose one of the students in the sample at random. Calculate P(allergies|female) and P(allergies|male). Are the events “female” and “allergies” independent? Justify your answer.
What is not independent?
P(allergies | female) = 50/130 ≈ 0.385
P(allergies | male) = 34/97 ≈ 0.351
Because these probabilities are not equal, the events “female” and “allergies” are not independent. Knowing that the student is female increases the probability that the student has allergies.