CHARACTERISTICS
ORGANIZATION
GRAPHS!
SCIENTIFIC METHOD
100
Basic and fundamental unit of life
The Cell
100
Groups of similar cells carrying out similar or related functions.
Tissue
100
What is the difference between an independent and dependent variable?
Independent variable: This is what you can manipulate during an experiment
Dependent Variable: This is the affected variable that measures the effect of the experiment.
100
The systematic and reasoned process that must be followed for the obtention of truth in science.
Scientific Method
200
Define homeostasis.
Keeping internal conditions stable or in balance.
200
A group of Atoms forms a
Molecule
200
Attach is a sample graph of an experiment that was conducted. Determine the independent and dependent variable.
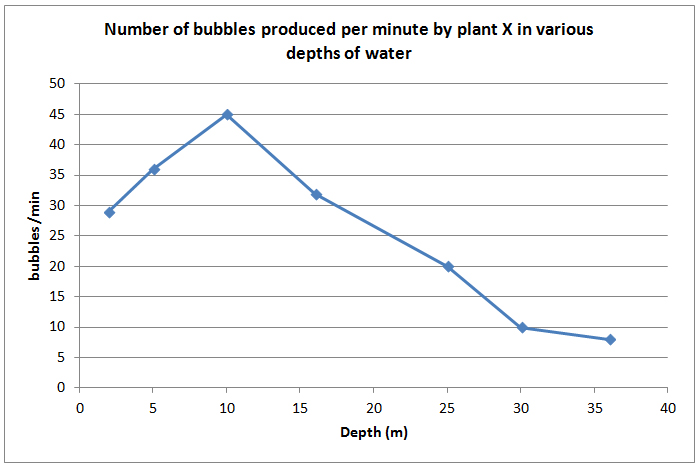
Independent Variable: Depth of water the plant was submerged in
Dependent Variable: Number of bubbles the plant produced per minute
200
What are the two types of observations that we had covered in class?
Qualitative and Quantitative Observations
300
It is the ability of living things to recondition themselves to environmental factors.
Adaptation.
300
Organisms of the same species living within a specific area
Population
300
What are the requirements for a proper graph in science?
A proper graph must have:
- Axis Labels on the x and y axis with units
- Graph Title
- Must have a legend if separate data are included on the same graph
300
Give an example of quantitative and qualitative observation:
Answer will vary....
1. Quantitative: observations that deals with a measured value
2. Qualitative: observations that deals with descriptions
400
A unknown species was discovered in the environment.
After further analysis, it was discovered that the unknown species grew in size over the next few days. When there is light, the species moved toward it. After two weeks, there were now two species in the container. Based on this, do you considered for this species to be considered as "living"? Please elaborate.
Yes, this species hits certain criterias such as:
1. Growth and Development
2. Response to the Environment
3. Reproduction
4. Utilization of Energy
400
Relationship of all living and nonliving things that interact in the environment where they live.
Biosphere
400
What's the difference between a bar and a line graph?
Bar Graph: When you are comparing categories of data
Line Graph: When you have continuous data over a period of time
400
In terms of data, what is the difference between accuracy and precision?
Accuracy: How close a given data to the known value
Precision: How close a set of data are within in one another
500
Enlist the Characteristics of living things.
(up to 3 examples are fine)
Made of One or More Cells, Displays Organization, Grows and Develops, Reproduces, Respond to Stimuli, Requires Energy, Maintains Homeostasis, Adaptations evolve over time.
500
Order the following from smallest to biggest:
Atoms // Community // Organs Systems // Ecosystem // Biosphere // Cell
Correct Order: Atoms, Cell, Organs Systems, Community, Ecosystem and Biosphere
500
Mr. Cortez is assigning you to conduct an experiment with a list of materials:
Sunflower Plant, Vinegar, Salt Water, Regular Water, Soda, Orange Juice, Light Bulbs, Plastic Cup, Ruler
Design an experiment using these materials and determine the independent variable, dependent variable, and controlled experiment for this.
Answers may vary...
Independent: something you manipulate (different types of liquids being used for the plant
Dependent Variable: The effects such as Plant Growth/Survivability within the next few days
Controlled Experiment: A sunflower plant not receiving any treatment or just using plain water.
500
What approach is considered to be the most ideal way to explain the discoveries after an experiment? Please elaborate on this approach.
CER Approach
- Stands for "Claim, Evidence, and Reason" which is a good argumentative writing tool to discuss the lab results and connect that with scientific principles