Colors That Are Red
Hypothesis Testing
S words
A Single Letter
Miscellaneous
100
Relative to the mean, values within the red shared area fall within one of these.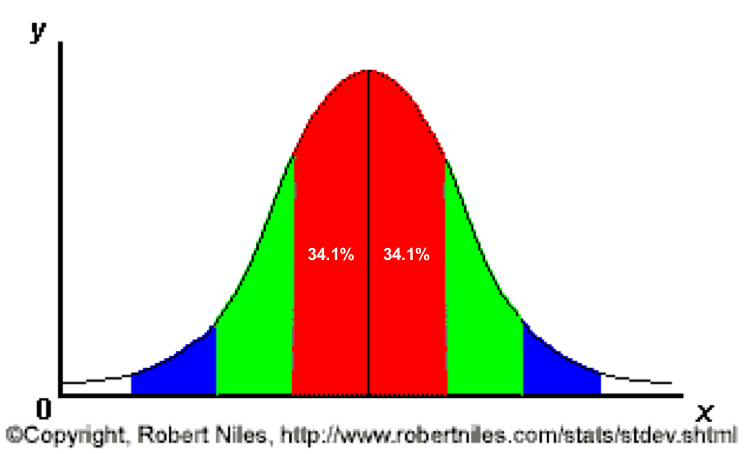
What is the standard deviation?
100
Falsely rejecting the null hypothesis
What is a Type I Error?
100
The true negative rate.
What is the specificity?
100
In a group of values, this is used to represent how many standard deviations particular value is from the overall mean.
What is Z?
100
The probability of drawing an ace or heart from a deck of cards?
What is 16/52 or 31%?
200
The direction that this red graph is skewed.
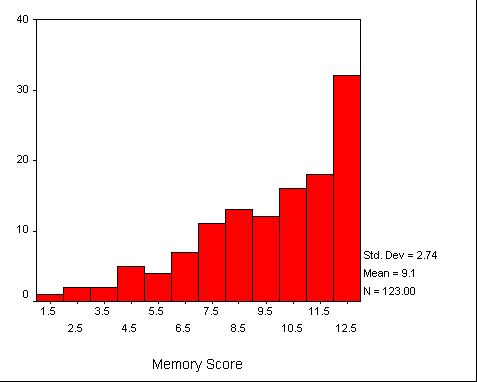
What is skewed left?
200
A study's probability of finding a difference or effect if one truly exists.
What is Power?
200
p<0.05 often indicates this.
What is statistical significance?
200
Assuming normally distributed data, this test is used to compare two means.
What is t?
200
Name of the brewery where William Sealy Gosset was employed when he developed the t distribution.
What is Guinness?
300
The range covered by the red.
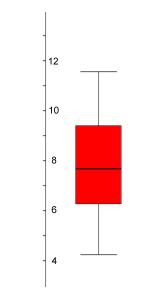
What is the interquartile range?
300
Falesly accepting the null hypothesis.
What is Type II Error?
300
True Positives/True Positives & False Negatives
What is sensitivity?
300
By relying on this value, the results of a study can only be defined in two ways: significant or not significant.
What is p?
300
The number of quarters in a football game.
What is 4?
400
The value represented by the red line.

What is the median?
400
Greek letter that represents Type I Error rate.
What is alpha?
400
This type of bias is often referred to as cherry picking.
What is selection?
400
In a meta-analysis, this value squared is the percentage of variation among the studies that's due to heterogeneity.
What is I?
400
Number of halves in a football game.
What is 2?
500
The red diamond in this figure: 
What is the summary estimate?
500
1- Beta
What is Power?
500
This type of analysis is used for data in which “time to an event” is of interest, e.g. time to structural failure following rotator cuff repair.
What is survival?
500
In an ANOVA comparing the mean of 3 groups, this statistic represents the ratio of the variability between the groups to the variability between the groups.
What is F?
500
A method that uses the process of repeated random sampling to simulate estimates of unknown parameters. Also, the casino pictured here.
What is Monte Carlo?