Association
Types of Data
Two-way tables (calculator)
Residuals
Scatter plots
100
Determine the association shown in the scatter plot below.

linear
100
What are the two types of data being looked at?
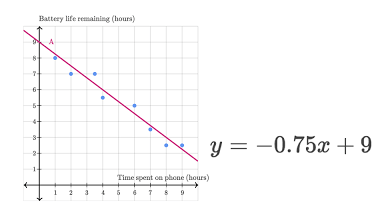
Time on phone and battery life
100
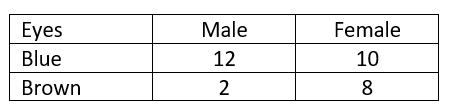
Calculate the percentage of Females surveyed?
=18/32= 0.5625=56.25%
100
The actual value of a point is (1,2), the best fit equation is y=2x+1/2
Is the residual positive or negative?
Negative
100
When describing a relationship between 2-variables you use 3 characteristics. They are;
Direction
Strength
Form
200
Determine the association of the scatter plot below.

nonlinear
200
Give an example of numerical data
numbers
200

Calculate the percentage of blue-eyed males.
=12/32=0.375=37.5%
200
How do you determine the value of a residual?
actual value - estimated value = residual
200
This is the residual plot for a linear regression. Is a linear model appropriate?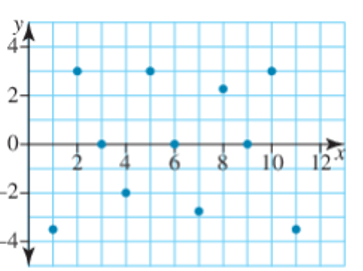
yes - random residuals
300
Determine the association in the scatter plot below.
Hint: This graph has no clear pattern, so ask yourself, is there any association in the graph?

no association
300
Give an example of Categorical Data
Words
300
What percentage of students have no curfew?
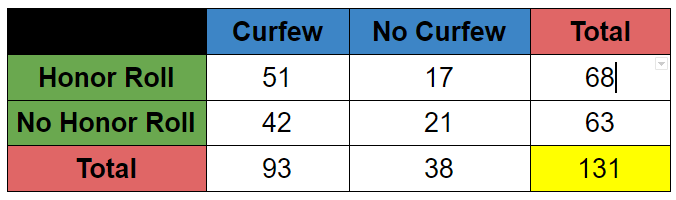
29%
300
How do you determine the estimated value?
Use the equation for the line of best fit
300
Describe the scatter plot in terms of strength, direction and form.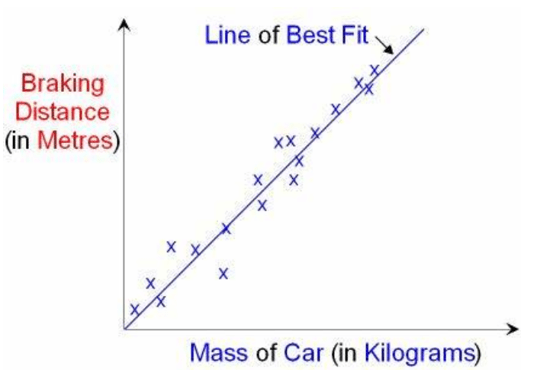
Strength - Strong
Direction - Positive
Form - Linear
400
Determine the full (type, strength, and ???) association of the scatter plot.

(strong?) Negative linear association
400
Is the following example Univariate or Bivariate data?
The weekly income of year 12 students
Univariate
400
How many people prefer a catered dinner?
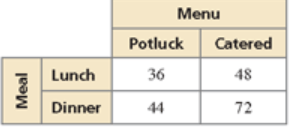
72
400
An actual value is given in a scatter plot as (5, -11.5). An equation for a linear model is y=-3x + 2.5. What is the residual for this point?
1
400
What is the maximum number of calories burned when you exercise for 80 minutes?
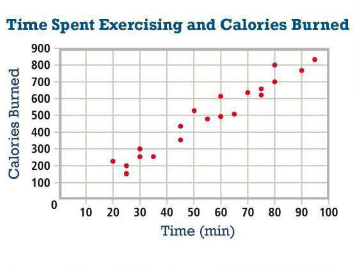
800
500
Describe a real world relationship that would have a strong positive association.
Possible answer: As number of hours studied increase, test scores would increase
500
Is the following example Univariate or Bivariate data?
The length and mass of new born babies
Bivariate
500
How many freshman are participating in the fundraiser? 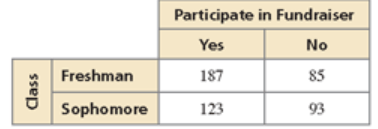
272 freshman
500
A residual plot shows what about a linear model?
Whether a linear model is appropriate and the accuracy of the actual value to the estimated value. Smaller residuals indicate more accuracy
500
What would be the starting and ending points of the trend line for the following scatter plot.
What is (8,0) to start and (95,900) to end
Accepted: Start x-value 5-10
End x-value 90-100