Correlations
Scatter Plots
Vocabulary
Two-Way Tables
Linear Equations
100
The size of the bag of popcorn and the price of the the popcorn.
What is positive correlation?
100
The horizontal axis.
What is the x axis?
100
Is a line that best fits the data.
What is the line of best fit?
100
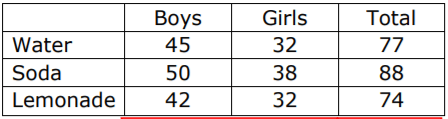
What is the percentage of boys that regulary drink water?
33%
100
The line of best fit is used for these two reasons.
What is to clarify a correlation and to predict future outcomes?
200
The increase in temperature and the number of snowboards sold.
What is negative correlation?
200
The vertical axis.
What is the y-axis?
200
Positive Association
means that a relationship appears to exist between two variables, and that relationship is positive 100% of the time.
200
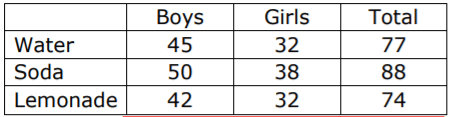
What is the percentage of girls that regularly drink soda?
37%
200
The formula used to find slope is this.
What is y2-y1 over x2 - x1?
300
The number of hours you work and the amount you get paid.
What is positive correlation?
300
You can place this on your axis, if you need to "fast forward" your axis to a section of higher numbers but then use small increments.
What is a break in the graph?
300
Negative Association
a relationship between two variables in which one variable increases as the other decreases
300
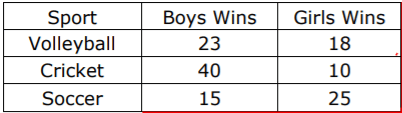
What percentage of the total students played volleyball?
31%
300
Every ordered pair looks like this.
What is (x,y)?
400
The less you eat, the more you feel hungry.
What is negative correlation?
400
Suzy is drawing a scatter plot, her data is as follows: (3, 67) (2, 70) (1, 72) (0, 74). This is how you should label the x-axis.
What is go up by 1s?
400
This type of data's graph compares.
What is bivariate data?
400

What percentage of total students are girls that win at cricket?
8%
400
The slope of a line going through the points (0,0) and (1, 2).
What is 2?
500
The relationship betweent the number of jellyfish in the ocean and the number of text messages you got last Friday.
What is no correlation?
500
Suzy is drawing a scatter plot, her data is as follows: (3, 67) (2, 70) (1, 72) (0, 74). This is how you should label the y-axis.
What is put a break in the graph to start at 66 and then increase by 1s?
500
This is a two-way frequency table with percentages.
What is a Relative Frequency Table?
500
How many students said they "do not like" skateboards?
35
500
The slope of the line going through these points: (-4, -7) and (9, 17)?
What is 24/13?