Two-Way Frequency Tables
Scatter Plots/Correlation Coefficient (No Calculator)
Regression Equations/Correlation Coefficient (Some Calculator)
100
How many males were surveyed?

26
100
Which of the following scatter plots would have a correlation coefficient closest to a -1?


100
The scatter plot below shows the profit, by month, for a new company for the first year of operation. Kate drew a line of best fit, as shown in the diagram.

Using this line, what is the best estimate for profit in the 18th month?
1) $35,000 2) $37,750 3) $42,500 4) $45,000
3) $42,500
200
What is the relative frequency of males who like Social Studies?

8/56
200
Given the scatter plot shown below, which of the r-values would most likely represent the correlation between the two variables?

(1) r = 0.88 (3) r =1
(2) r = 0.28 (4) r = -0.94
(1) r = 0.88
200
The scatter plot below shows the relationship between the number of members in a family and the amount of the family's weekly grocery bill.

The most appropriate prediction of the grocery bill for a family that consists of six members is
1) $100 2) $300 3) $400 4) $500
2) $300
300
To the nearest whole number, what percent of the students surveyed were female?
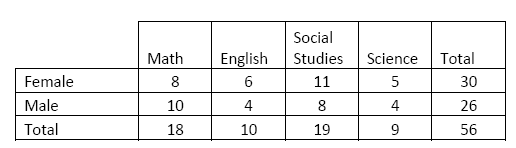
30/56 = 54%
300
Bella recorded data and used her graphing calculator to find the equation for the line of best fit. She then used the correlation coefficient to determine the strength of the linear fit.
Which correlation coefficient represents the strongest linear relationship?
1) 0.9 3) -0.3
2) 0.5 4) -0.8
1) 0.9
300
The table below shows the number of grams of carbohydrates, x, and the number of Calories, y, of six different foods.

Which equation best represents the line of best fit for this set of data?
1) y = 15x 3) y = 0.1x − 0.4
2) y = 0.07x 4) y = 14.1x + 5.8
4) y = 14.1x + 5.8
400
Given the person rides a train, what percent (to the nearest whole number) are from New York?

25/51=49%
400
The scatterplot below compares the number of bags of popcorn and the number of sodas sold at each performance of the circus over one week.

Which conclusion can be drawn from the scatterplot? 1) There is a negative correlation between popcorn sales and soda sales.
2) There is a positive correlation between popcorn sales and soda sales.
3) There is no correlation between popcorn sales and soda sales.
4) Buying popcorn causes people to buy soda.
2) There is a positive correlation between popcorn sales and soda sales.
400
Emma recently purchased a new car. She decided to keep track of how many gallons of gas she used on five of her business trips. The results are shown in the table below.

Write the linear regression equation for these data where miles driven is the independent variable. (Round all values to the nearest hundredth.)
y = 0.05x − 0.92
500
Jenna took a survey of her senior class to see whether they preferred pizza or burgers. The results are summarized in the table below.
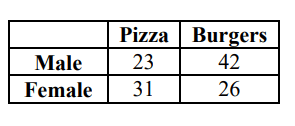
Of the people who preferred burgers, approximately what percentage were female? (Round to the tenths place)
26/68=38.2%
500
The results of a linear regression are shown below.

Which phrase best describes the relationship between x and y?
1) strong negative correlation
2) strong positive correlation
3) weak negative correlation
4) weak positive correlation
1) strong negative correlation
500
The table below shows the price of a new cell phone and the length of time, in months, since its release.
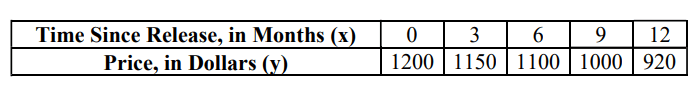
State the linear regression equation for this set of data. Round all values to the nearest hundredth.
State the correlation coefficient for this data set, to the nearest hundredth.
State what the correlation coefficient indicates about the linear fit of the data.
y = −23.67x + 1216
−0.99
Strong, negative relationship. As time goes on, the price goes down.