Circles
Volume
Cross-Sections
Statistics
Box Plots
100
The ______ is a line segment drawn from the center of a circle to a point on the circle.
Radius
100
How many faces are there on a rectangular prism?
6 faces
100
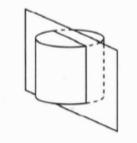
If a cylinder is sliced from top to bottom as shown, what is the resulting cross section?
A rectangle (or parallelogram)
100
How do you calculate the range of a data set?
Subtract the smallest number (minimum) from the largest number (maximum).
100
What are the 5 points that make up a box plot?
Minimum, 1st quartile, median, 3rd quartile, and maximum
200
The _____________ is the distance around the circle.
Circumference
200
What does a capital B stand for in the formula
V = B * h ?
AREA of the base (the 2D base of the 3D figure)
200
If a cylinder is sliced horizontally as shown, what is the resulting cross section? 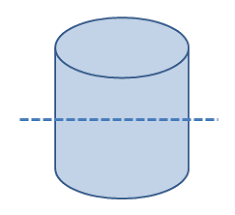
A circle
200
How do you calculate the mean, or average, of a data set?
Add all pieces of data (numbers) together, then divide by how many pieces of data (numbers) there are.
200
In the box plot below, what is the median of the data?

44
300
The ________ is the distance across the widest part of the circle.
Diameter
300
What is the formula for volume of a rectangular prism?
V = l*w*h or V= B*h
300
If the pyramid below is sliced horizontally as shown, what is the resulting cross section?
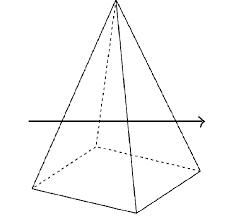
A rectangle (or square)
300
What is the median of these numbers?
90, 75, 60, 80, 90
80
(Don't forget to sort them in order first!)
60, 75, 80, 90, 90
300
In the box plot below, what is the maximum of the data?
85
400
How do you find the circumference?
C=d*pi or C = 2*r*pi
400
What is the volume of the rectangular prism?
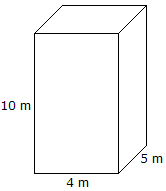
200
m^3
400
If the pyramid is sliced vertically but off-center as pictured, then what is the resulting cross section?
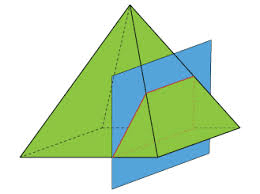
A trapezoid
400
The ____ is the most occurring number in a data set.
Mode
400
In the box plot below, what is the Interquartile Range (IQR)?
57 - 28 = 29
500
What is the formula for area of a circle?
A = r^2 *pi or A=r*r*pi
500
What is the surface area of the rectangular prism?

220
m^2
500
If the cone is sliced vertically through the center as pictured, what is the resulting cross section?
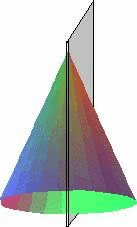
A triangle
500
What are the median, first quartile and third quartile of this data set?
6, 6, 7, 9, 10, 12
1st quartile: 6
Median (2nd quartile): 8
3rd quartile: 10
500
In the box plot below, data pieces 13 through 28 represent the lower ___% of all the data.
25% (A quartile is a quarter, or 1/4 of the data)