Create Box Plots
Read Box Plots
IQR/Variability
Percentages
100
Which box and whisker plot matches the data set?
12, 5, 15, 20, 6, 17, 8
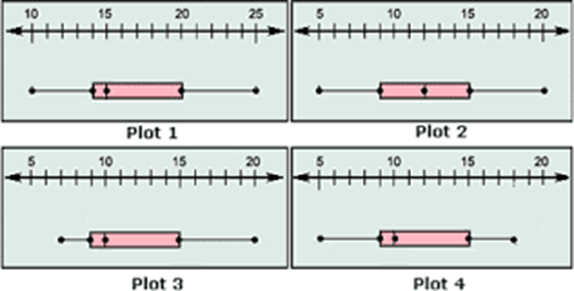
Plot 2
100
What is the Median of the box and whisker plot?
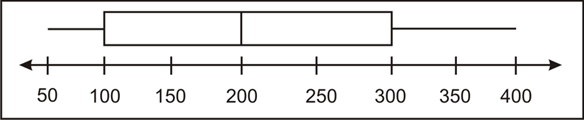
200
100
Mrs. Knorr collected information on the number of siblings her students have. She found that the range of the data was 8. Which of the following best describes what a range of 8 means?
a. The average distance each point is from the mean is 8.
b. The difference between the upper quartile and the lower quartile is 8.
c. The difference between the highest data value and the lowest data value is 8.
d. The difference between the mean and the median is 8.
c. The difference between the highest data value and the lowest data value is 8.
100
What percent of the data is between 79 and 94?
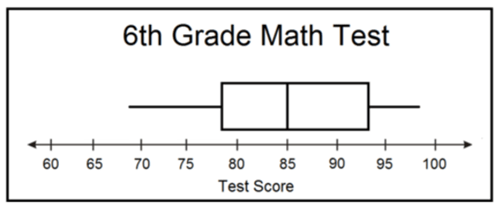
50%
200
How does a Box and Whisker Plot display data?
a. In halves b. In quarters
c. As an average d. By range
b - Quartiles (Quarters)
200
CHANCE - Pass or Play?
Lose 100 Points
200
A set of data has a maximum of 21, a minimum of 4, a lower quartile of 7, a median of 12, and an upper quartile of 17. What is the interquartile range?
10
Q3 - Q1 = 17 - 7
200
What percent of the data is between 85 and 94?
25%
300
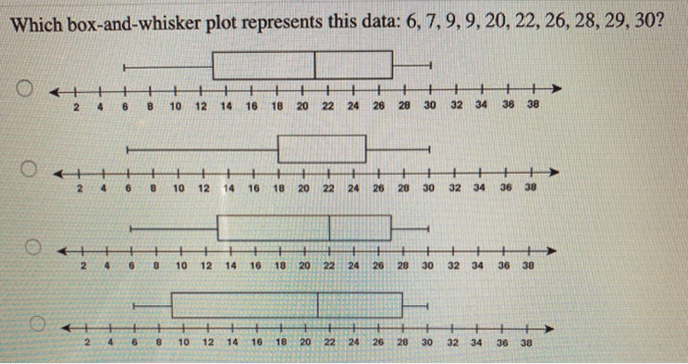
Plot D
300

Which of the following is true about the box and whisker plot?
a. The lower quartile is 68
b. The median is 80
c. The upper quartile is 94
d. The maximum is 100
c. The upper quartile is 94
300
Mrs. Knorr kept data on how far she walked her dog each day. After a few months, she noted that her interquartile range was 3 miles. Which of the following statements Best describes what an interquartile range of 3 means?
a. The middle of the data is 3.
b. The average distance she walked her dogs is 3 miles.
c. The data spans 3 units on the number line.
d. The middle 50% of the data spans 3 units on the number line.
d - variation of the middle 1/2 of the data
300
CHANCE - Pass or Play?
Gain 100 Points
400
Using the following table, which data set contains the numbers required to create a Box and Whisker Plot:
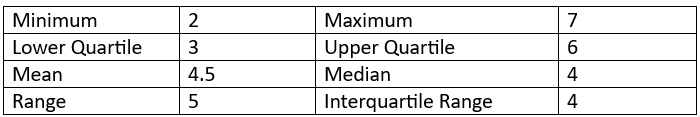
a. 2, 3, 4.5, 6, 7 b. 3, 4, 4, 5, 7 c. 2, 3, 4, 5, 6 d. 2, 3, 4, 6, 7
d - 2, 3, 4, 6, 7
(minimum, Q1, median (Q2), Q3, maximum)
400
Given the following data set, what number would go in the shaded grey box? 2, 7, 4, 3, 8, 4, 5, 0
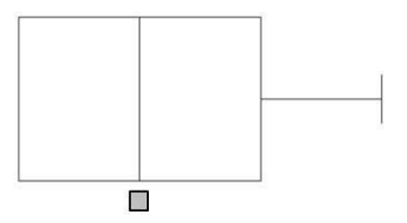
a. 4 b. 4.5 c. 5 d. 5.5
4 (Median or Q2)
0, 2, 3, 4, 4, 5, 7, 8
400
CHANCE - Pass or Play?
Airheads for the Row
400
What percent of the data is between 79 and 99?
75%