Range/IQR
Dots and Plots
Histograms
Quartiles
100
To find the range of something, what do we have to do?
What is subtract the minimum value from the maximum value?
100
What are the five data points we need to create a box plot?
What is minimum, lower quartile, median, upper quartile and maximum?
100
A Histogram shows the frequency of a set of data between what?
What is ranges?
100
On box plot, how many quartiles can we see?
What is 4?
200
Find the Range of the following set of data
15, 92, 14, 58, 11, 76, 15, 48
What is 81?
200
Create a dot plot for the following data 0, 1, 1, 3, 0, 1, 2, 0, 0, 2, 1, 1
4 dots at 0
5 dots at 1
2 dots at 2
1 dot at 3
200
Draw a Histogram from the following data regarding amounts of tacos eaten by staff in the teacher's lounge.(Use ranges of 5) 2, 5, 8, 14, 15, 1, 2, 9, 4
0-5: 5
6-10:2
11-15:2
Bars must touch.
X axis label: tacos eaten
Y axis label: frequency
200
What percentage of data is in the range from the minimum value to the upper quartile/Q3?
What is 75%
300
How do we find the interquartile range?
What is the lower quartile subtracted from the upper quartile?
300
Create a box plot using the following data: Maximum = 23.5, Lower Quartile = 16, Minimum = 13, Median = 20.5, Upper Quartile = 23
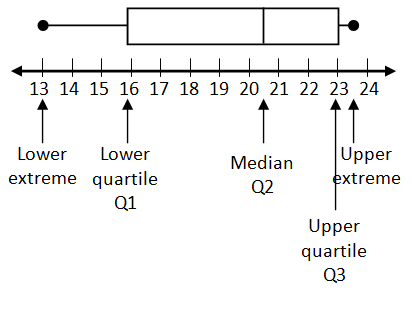 Mr. Watkins will check your answer
300
Name an advantage of using a Histogram over a Dot Plot
Easier to see data trends
(Other answers may be accepted)
300
What is another name for the 2nd quartile?
What is median?
400
If the Interquartile range of Mr. Cogswell's basketball points is 9 and his upper quartile is 16. What is his lower quartile of basketball points?
What is 7?
400
Which part of a box and whisker plot shows the interquartile range?
the box
400
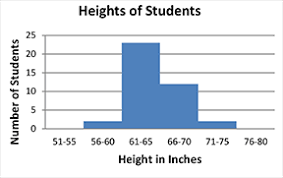
About how many students were at least 66 inches tall?
Around 14
400
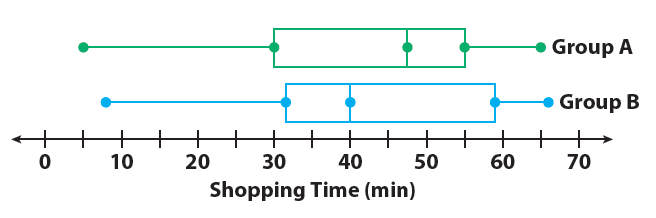 Which group had the shortest shopping time?
Group A with a minimum of 5 minutes
500
What is the interquartile range?
7
500
What type of average can we see on dot plots, that we can't see on box plots?
What is mode?
500

What was the range of the number of movies watched?
4
500

Which lion walked more miles on average?
Mona