The 3 M's & Range
Dots & Plots
Histograms
Frequency Tables
Grab Bag & Correlation
100
To find the range we do this.
What is subtract the minimum value from the maximum value?
100
What are the five things we need to create a box plot?
What is minimum, lower quartile, median, upper quartile and maximum?
100
The shape of this histogram.

What is left skewed?
100
This is the frequency of the age in the bin 50-60.

What is 5?
100
What is Jan's nickname
J squared
200
The mode of the data set 5, 8, 15, 6, 9, 8, 4.
What is 8?
200
This box plot has a higher variability in temperature.

What is Pittsburgh?
200
This is frequency of the bin 70-79 of the data set 66, 70, 88, 72, 99, 75, 66, 80, 77.
What is 4?
200
A survey of 9th and 10th graders was given to determine what their favorite subject was. 72 said Math (50 which were freshmen), 38 said Social Studies (20 which were sophomores), and 40 freshmen and 50 sophomores said PE was their favorite. The number of students surveyed.
What is 200?
200
What is the name of the superintent of Gateway?
Dr.Bill Short
300
The median of the data set 5, 8, 15, 6, 9, 8, 4
What is 8?
300
The shape of this dot plot.

What is right skewed?
300
The shape (normal/symmetric or skewed) of the histogram for the data set is 5, 3, 3, 2, 1, 4, 4, 3.
What is normal/symmetric?
300
A survey of 9th and 10th graders was given to determine what their favorite subject was. 72 said Math (50 which were freshmen), 38 said Social Studies (20 which were sophomores), and 40 freshmen and 50 sophomores said PE was their favorite. How many freshmen said their favorite subject is Social Studies?
What is 18?
300
What type of assignments do you do instead of homework?
IXLs
400
The mean of the data set 5, 8, 15, 6, 9, 8, 4 (rounded to nearest thousandths).
What is 7.86?
400
This dot plot has a higher mean.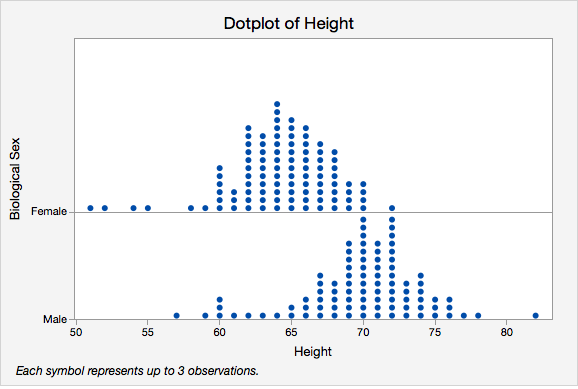
What is male?
400
The type of average we can see on histograms that we can't see on box plots.
What is mode?
400
A survey of 9th and 10th graders was given to determine what their favorite subject was. 72 said Math (50 which were freshmen), 38 said Social Studies (20 which were sophomores), and 40 freshmen and 50 sophomores said PE was their favorite. What percent of of students said math were their favorite?
What is 36%?
400
What do we call the number that is multiplied by a variable in algebra?
coefficient
500
A cricketer's batting average is formed from adding up all their runs and then dividing that by the number of times they have been out. What type of average is this?
What is mean?
500
The data set is 5, 3, 3, 2, 1, 4, 4, 3. The first (lower) quartile value would be this. (hint: think of creating a box plot)
What is 2?
500
This is the inter-quartile range of the data set 2, 5, 7, 6, 4, 3, 5.
What is 3?
500
A survey of 9th and 10th graders was given to determine what their favorite subject was. 72 said Math (50 which were freshmen), 38 said Social Studies (20 which were sophomores), and 40 freshmen and 50 sophomores said PE was their favorite. What percent of of those who said math were their favorite are sophomores?
What is 31%?
500
What is the best measure of variability if there is an outlier?
IQR