This is used to show data in a pictograph (hint: think about the name of the graph...)
a picture
I'm making a graph of the different kind of pets scholars have at home. What could I title my graph?
Line plots show data on a _________? (hint: think of the name)
Line/number line
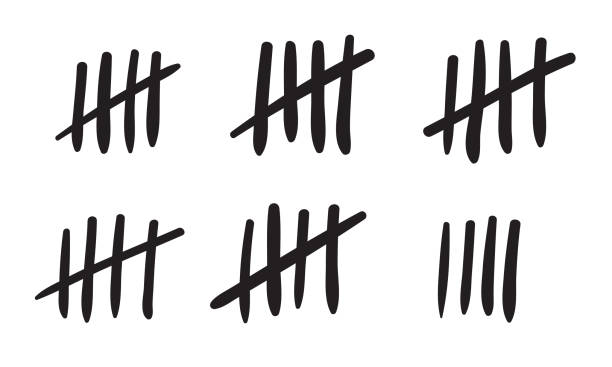
How many tallies are written normally before you make a cross tally?
4
 How many more laps did Austin run than William?
4
This tells you the value of each picture in the graph
the key or scale
Bar graphs show data using what? (Hint: think of the name)
Bars
What was the tallest height that was recorded?
54 inches
 How many tigers are there?
 How many people lived in Middlebury in 1941?
10,000
 Each star is worth 4. How much is represented by 3 stars?
12
 Which sport do people like the most? The least?
Soccer, "other"
How many kids are 53 inches or taller?
4
 Which drink choice had the most votes? How many votes did it have?
Coke; 19
 How many kids total voted for hamburgers?
7
How many apples were sold in March?
25 apples

Which two ice cream flavors are tied for first place? Which ice cream flavor came in second place?
Cherry and choco; berry

How many kids spent less than 2 hours watching TV?
6

6
 How many kids voted for popcorn? How many voted for cheese?
5, 7

How many more strawberries did Sally have than George?
7 strawberries
 Which sport do the same number of girls and boys like? Which sport is the girls' favorite? The boys' favorite?
Softball; soccer; basketball
 On which day were the most cars sold? How many cars were sold on the weekend?
Friday; 8 cars
 On which day were the least amount of children in school? How many fewer kids were there on Friday than on Wednesday?
4
 What percent of the day is spent on watching TV and bathing?
13%
