Graphing Quadratic Functions/Equations
Transformations
Solving Quadratic Equations
Successive Differences
Special Functions
100
Determine the domain range:
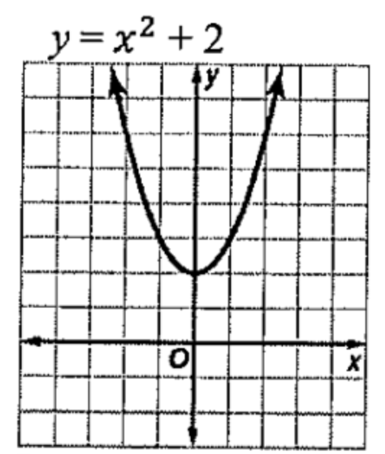
D: {all real numbers}
R: {y | y ≥ 2}
100
Describe how the graph of the function is related to the graph of f(x) =x2 . Function: g(x) = x2 + 1
translation up 1 unit
100
Solve the following quadratic equation:
x2 - 3x + 2 = 0
Solutions: 1 and 2
100
Provide the equation for a linear function, quadratic function, and exponential function.
Linear: y = mx + b
Quadratic: y = ax2 or y = ax2 + bx + c
Exponential Function: y = a1(r)x or y = abx
100
Identify the type of special function (provide both names):
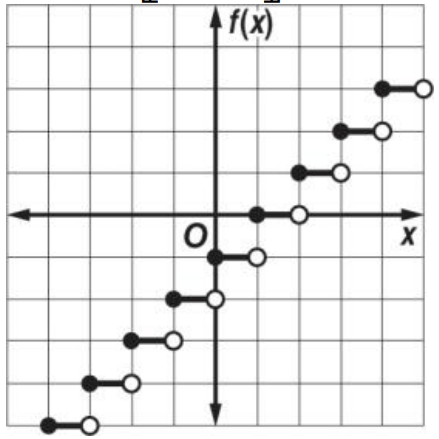
Step Function or Piecewise-Linear Function
200
Find the axis of symmetry: x2 - x - 12 = 0
AoS: x =
1/2
200
Describe how the graph of the function is related to the graph of f(x) =x2 .
Function: g(x) =(x - 6)2 - 3
Translation to the right 6 units and down 3 units
200
Solve the following quadratic equation:
x2 - 8x = -16
Solution: 4
200
Graph each set of ordered pairs. Determine whether the ordered pairs represent a linear function, a quadratic function, or an exponential function.
(-3, -1)(-2, -4)(-1, -5)(0, -4)(1, -1)
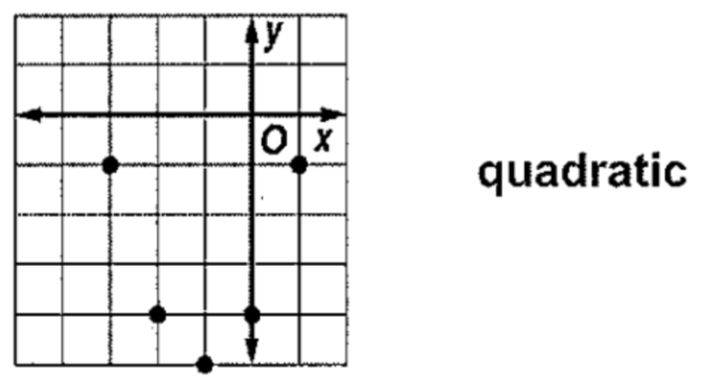
200
Provide the domain and range of the following function:
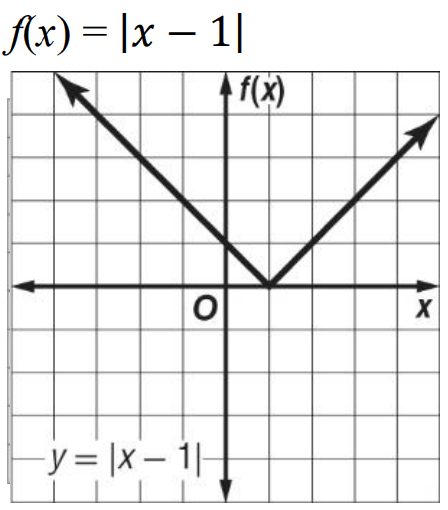
D:{all real numbers}
R:{f(x) | f(x) ≥ 0}
300
Find the axis of symmetry, vertex, and y-intercept:
y = -x2 - 4
AoS: x = 0
Vertex: (0, -4)
y-int: (0, -4)
300
Describe how the graph of the function is related to the graph of f(x) =x2 . Function: g(x) = -5x2
Stretched vertically and reflected across the x-axis
300
State the value of the discriminant and determine the number of real solutions:
2x2 - 10x - 9 = 0
172; 2 real solutions
300
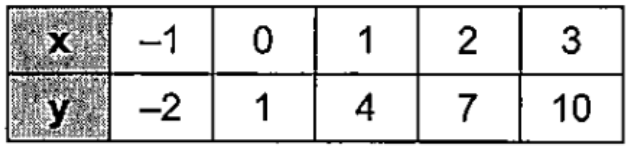
Look for a pattern in the table of values to determine which models best describes the data. Then write an equation for the function that models the data. 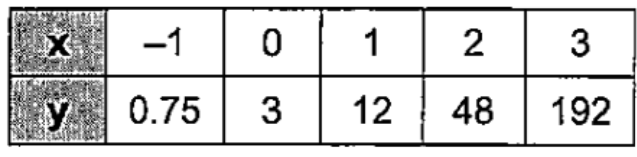
Exponential; y = 3(4)x
300
Identify the type of function, domain, and range:
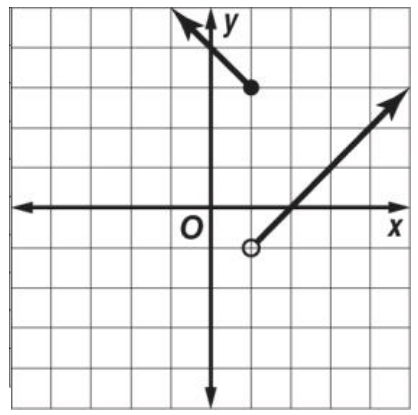
Piecewise-Defined Function
D:{all real numbers}
R:{y | y > -1}
400
Determine whether the function has a maximum or minimum value. State the maximum or minimum value and the domain and range of the function. 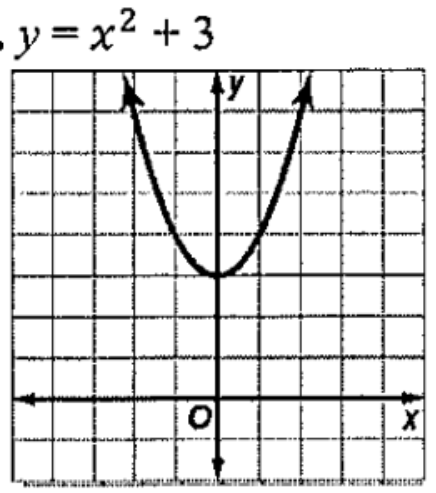
min.: (0,3)
D: {all real numbers}
R:{y | y ≥ 3}
400
Describe how the graph of the function is related to the graph of f(x) =x2 . Function: g(x) = -(x + 1)2
Translation to the left 1 unit and reflected across the x-axis
400
Solve the following quadratic equation:
2x2 + 9x + 4 = 0
Solutions:
-4 and -1/2
400
Look for a pattern in the table of values to determine which models best describes the data. Then write an equation for the function that models the data.
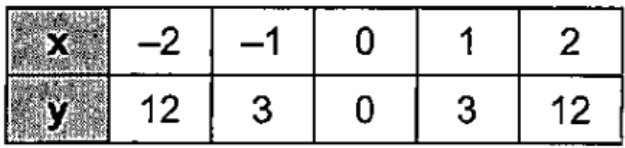
Quadratic; y = 3x2
500
Determine whether the function has a maximum or minimum value. State the maximum or minimum value and the domain and range of the function. Find the equation of the axis of symmetry.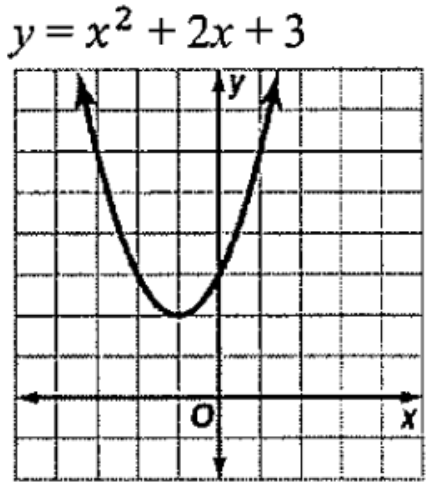
min.: (-1, 2)
D:{all real numbers}
R:{y | y ≥ 2}
AoS: x = -1
500
Describe how the graph of the function is related to the graph of f(x) =x2 . Function: g(x) = -1/4x^2 - 1
Compressed vertically, reflected across the x-axis, translated down 1 unit
500
Solve the following quadratic equation:
48x2 + 22x - 15 = 0
Solutions: -5/6 and 3/8
500
Look for a pattern in the table of values to determine which models best describes the data. Then write an equation for the function that models the data.
Linear; y = 3x + 1