10.1 Measures of Center
10.2 Measures of Variability
10.3 Mean Absolute Deviation
10.4 Compare Populations
10.6 Probability of Simple Events
10.7 Theoretical and Experimental Probability
10.8 Probability of Compound Events
100
Grams of fat per serving: 2, 7, 4, 5, 6, 4, 5, 6, 3, 5
What is the mode of the data?
5 grams
100
What is the range of the data?
31
100
25, 70, 75, 100
Find the mean absolute value of the data set.
21.25
100
What measure of center and measure of variation should be used to compare the data?
Median and IQR
100
A six-sided number cube whose sides are numbered 1 through 6 is rolled. What are the probability and the likelihood of the cube landing on an 8?
0; 0%
impossible
100
Bailey tossed a coin 40 times. The results were 25 heads and 15 tails. What is the experimental probability of tossing heads?
25/40; 62.5%
100
An interior decorator needs to buy bedroom furniture for a model home. She plans to select one item each from 7 dressers, 4 beds, 6 lamps, and 9 night tables. Find the total number of outcomes.
1512 outcomes
200
Number of students in each math class: 22, 23, 24, 22, 21
What is the median of the data?
22 students
200
The number of minutes spent reading each night: 31, 33, 32, 34, 35, 33
What are the values of quartile 1 and quartile 3?
Q1: 32
Q3: 34
200
7, 8, 4, 5, 8, 3, 5, 6
Find the mean absolute deviation of the data set.
1.5
200
When is it most appropriate to compare the centers and variations of two sets of data with mean and mean absolute deviation?
When both sets of data are symmetric.
200
A six-sided number cube whose sides are numbered 1 through 6 is rolled. What are the probability and the likelihood of the cube landing on an odd number?
1/2; 50%
equally likely
200
A spinner with four equal-size sections marked X, Y, Z, and Q is spun 100 times. The spinner lands on X 20 times. Compare the experimental probability and theoretical probability of the spinner landing on X.
20% < 25%
200
When Blake loads a washing machine, he needs to choose a load setting of large, delicate, or small; a water temperature setting of hot, warm, or cold; and a regular rinse cycle or an extra rinse cycle. What is the possible number of outcomes in this situation?
18 outcomes
300
Inches of rain last week: 1.5, 2, 2.5, 2, 1.5, 2.5, 3
What is the mean of the data? Round to the nearest tenth.2.1 inches
300
The number of fish in each fish tank: 6, 5, 7, 8, 5, 6, 7, 9, 8, 6
What is the interquartile range of the data?
2
300

Describe what the mean absolute deviation represents.
The average distance between the mean age of a TV series actor and the actual age is about 7 years.
300

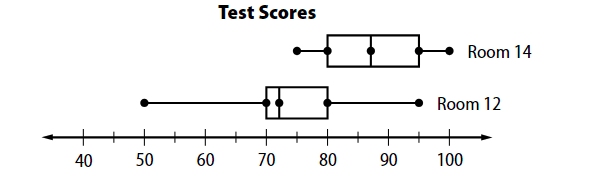
Compare the centers and variations using the double box plot. Write an inference you can draw about the two populations.
The median number of weekly patients for Dr. Lind is 16 with an interquartile range of 8. The median number of weekly patients for Dr. Gupta is 18 with an interquartile range of 5. Dr. Gupta centers around a higher number of weekly patients and has less variability than Dr. Lind.
300
A jar contains 5 blue marbles, 1 yellow marble, and 4 green marbles. What is the probability of randomly choosing a yellow marble?
1/10; 10%
Unlikely
300
One of the five equal sections of a spinner is blue. The spinner landed on the blue section 30 of the 75 times that it was spun. Compare the theoretical probability of the spinner landing on blue to the experimental probability.
theoretical probability(20%) < experimental probability (24%)
300
A newborn puppy is equally likely to be male or female. What is the probability that the first four puppies that a dog gives birth to are female?
1/16; 6.25%
400
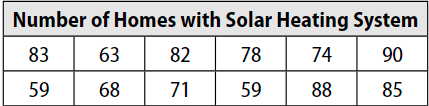
What are the mean, median, and mode of the data?
Mean: 24.75
Median: 26
Mode: none
400

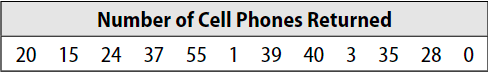
Find all outliers in the data.
8, 44, and 50
400
A survey in one middle school showed that 3 out of 5 students enjoy playing dodgeball. Predict the number of students that enjoy playing dodgeball if there are 485 students in the school.
291 students
400
A sheet set is available in four different colors: red, green, purple, or blue. The sheets are sold in three different sizes: twin, queen, or king. What is the number of outcomes for this scenario?
Assuming there are an equal number of sheet sets in each color, what is the probability that you randomly select a blue sheet set?
12
1/4; 25%
500
At the movie theater, six movies are playing, and their lengths are 138, 117, 158, 145, 135, and 120 minutes. Which measure of center best represents the data? Justify your selection.
mean; there are no extreme values or identical numbers.
500
The measures of variability have been found for the scores Mr. Han's students earned on their last test. R: 41; M: 82; Q1: 76; Q3: 87.5; IR: 11.5.
Use the measures of variability to describe the data.
The range of the data is 41 points. The median is 82 points. One-fourth of the students earned 76 points or less. One-fourth of the students earned 87.5 points or more. Half of the students earned between 76 and 87.5 points.